Mastering Harmonic Patterns: Geometric Technical Analysis Guide
The Bullish Gartley hints at a strong bounce after a measured pullback, while the Bearish Gartley warns of a sharp drop after an extended rise, both shaped by precise Fibonacci ratios.
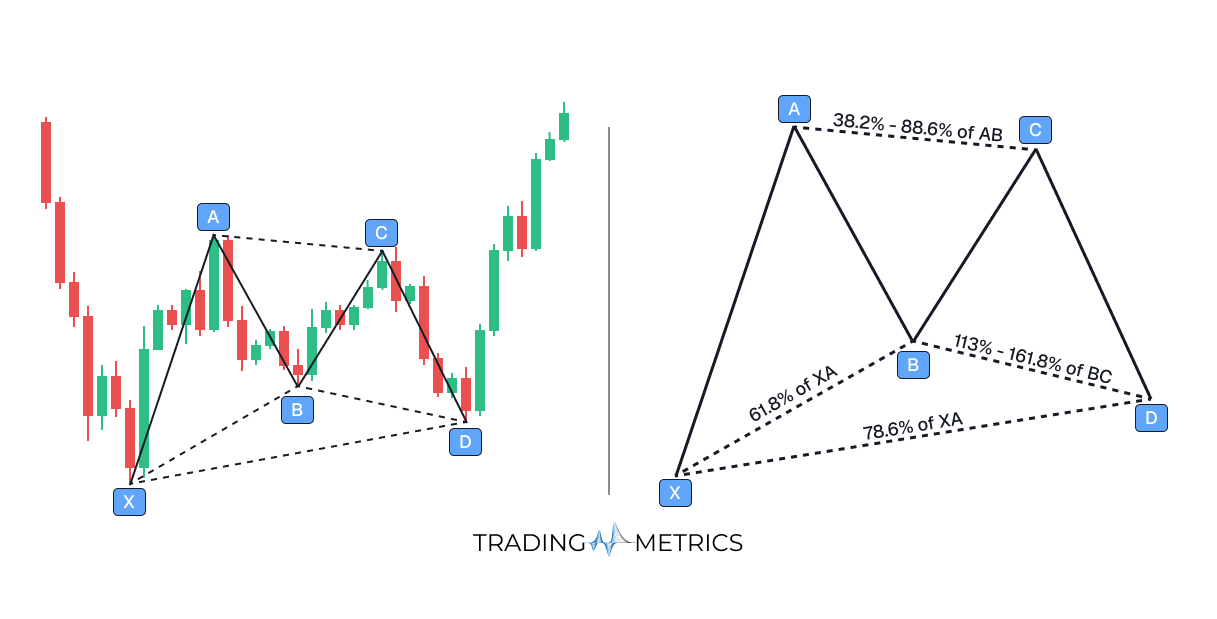
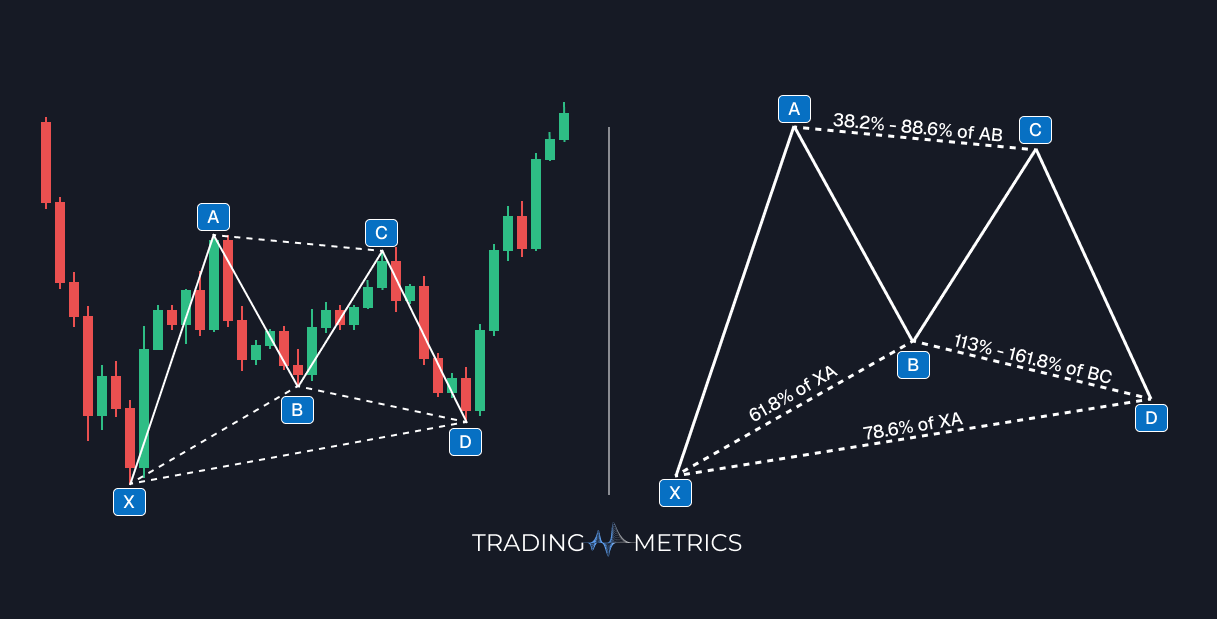
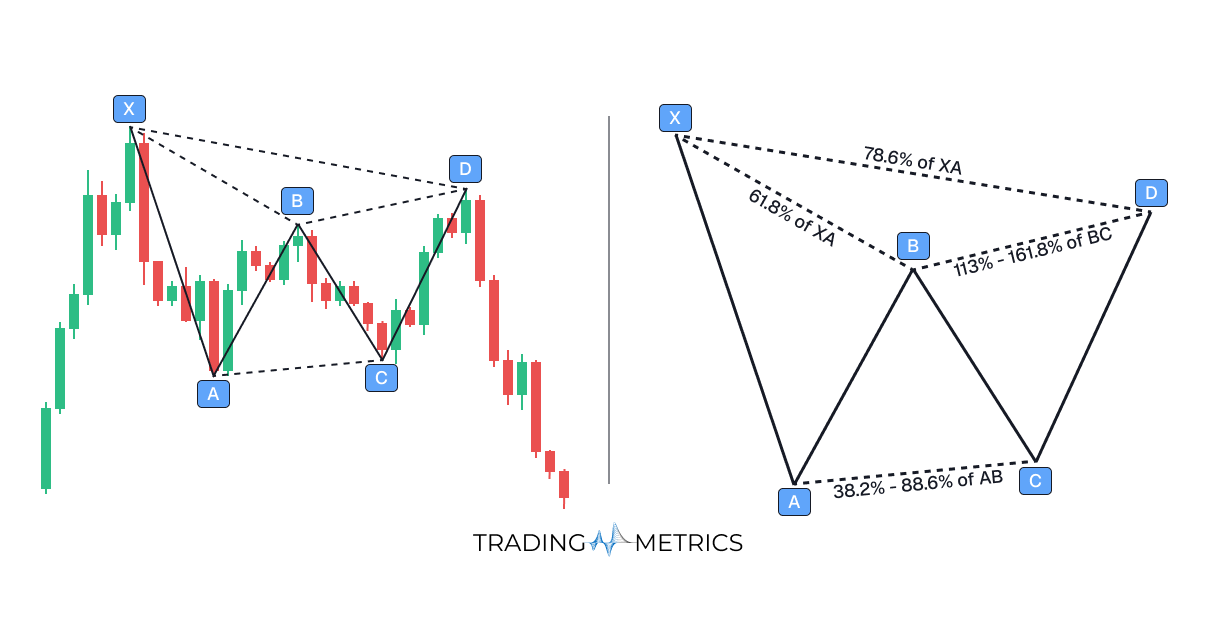
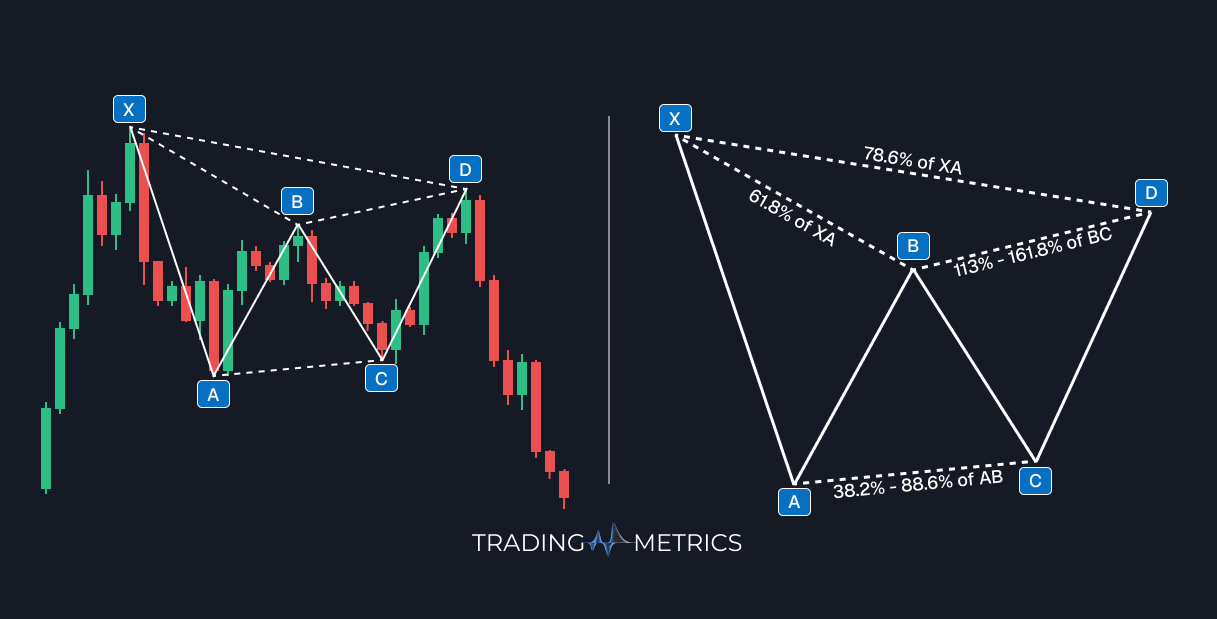
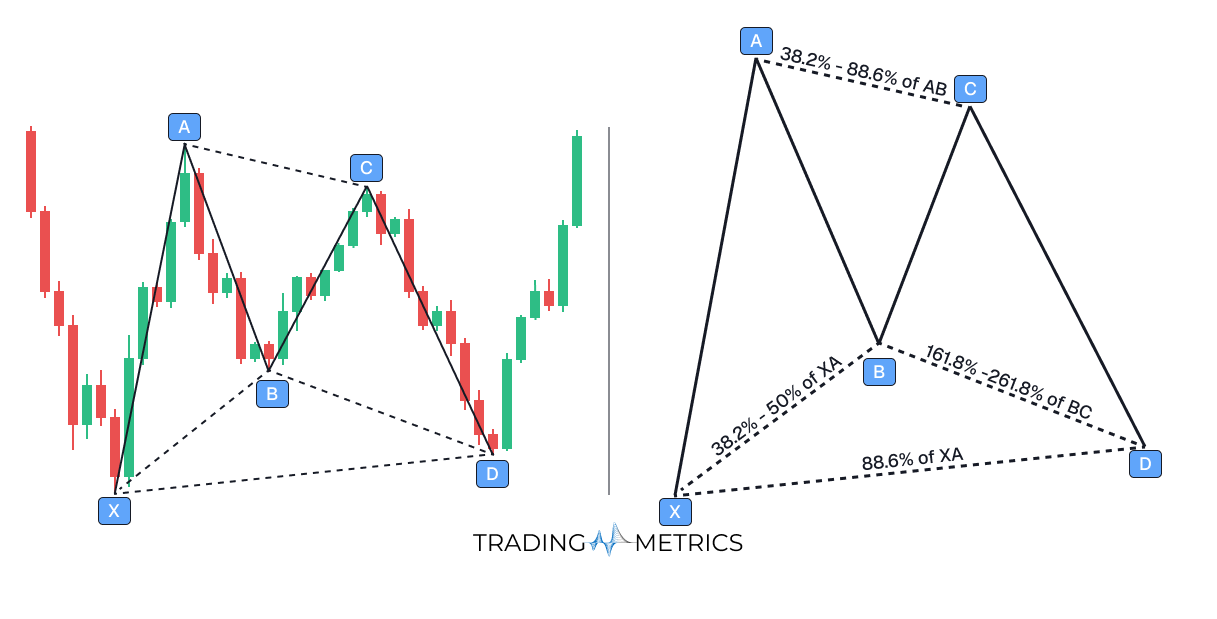
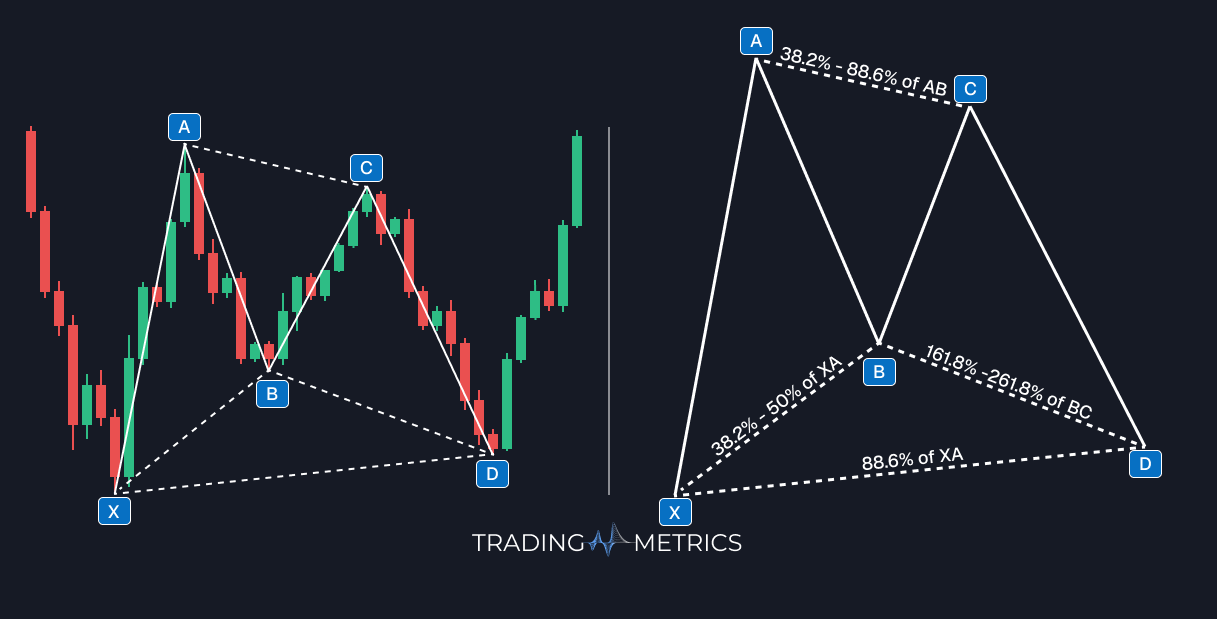
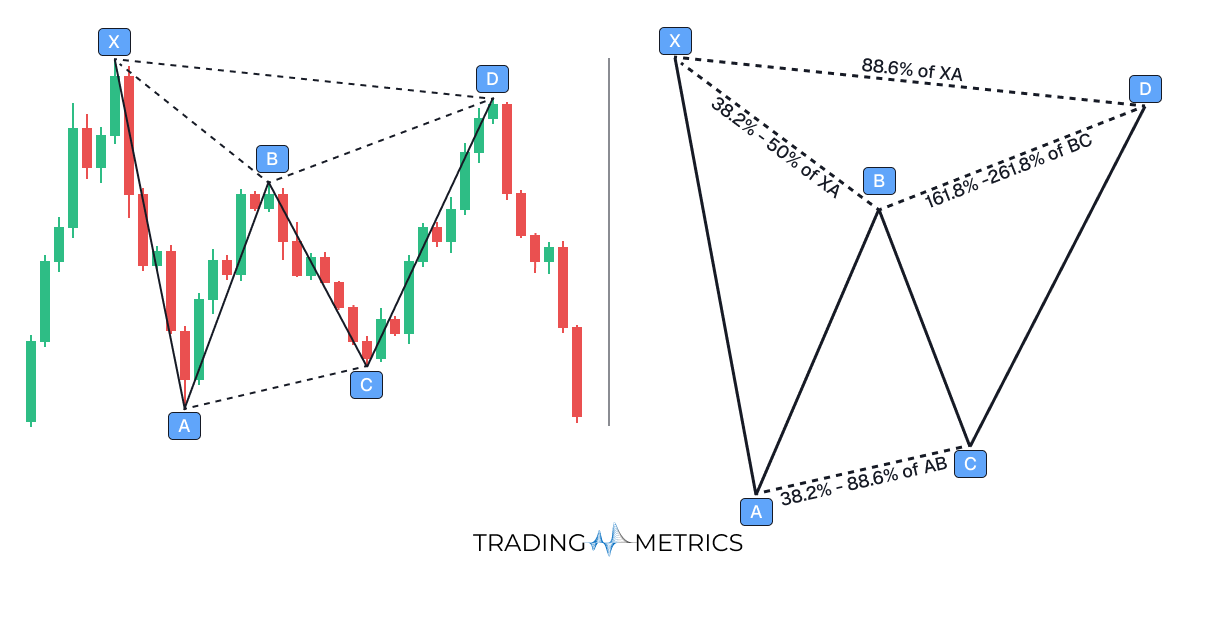
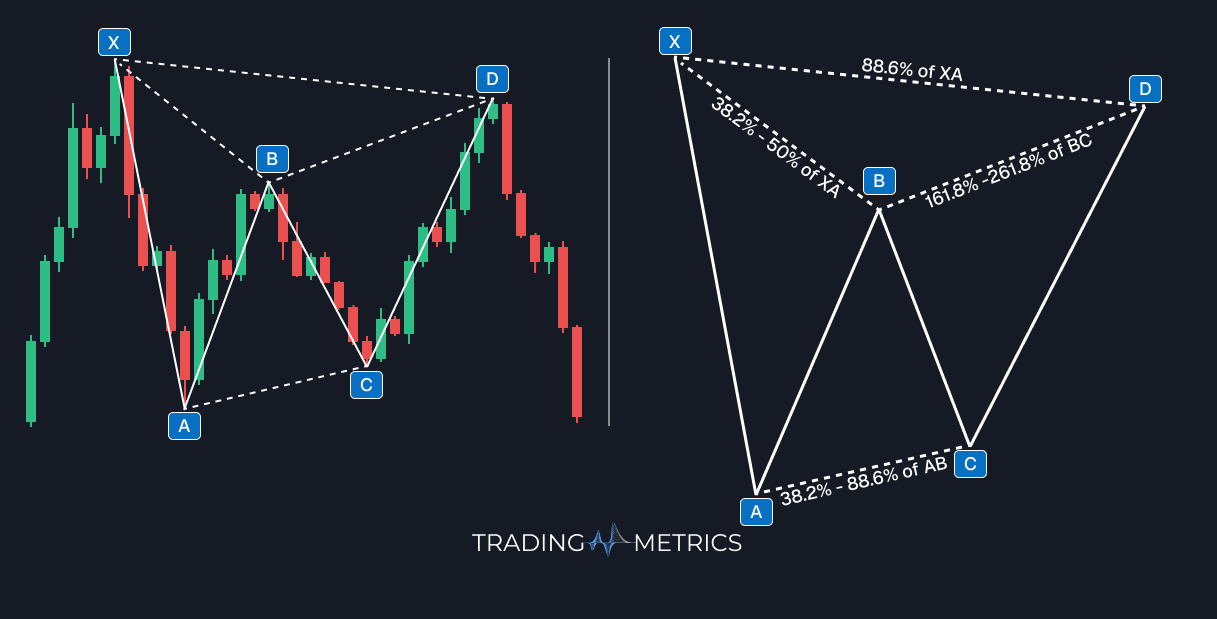
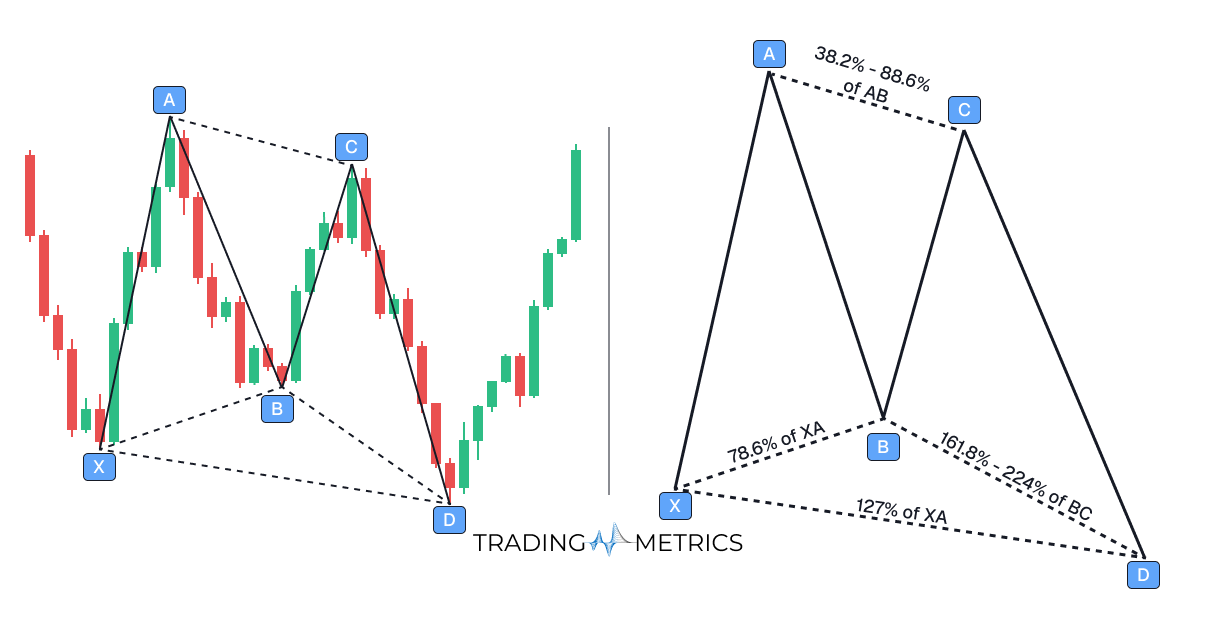
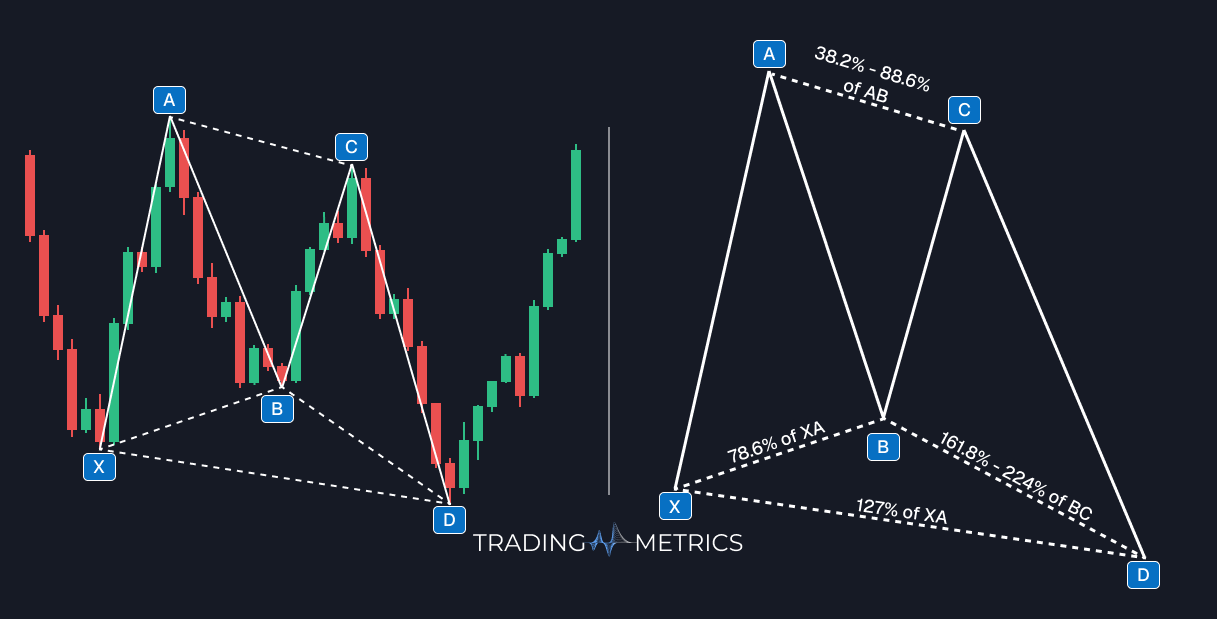
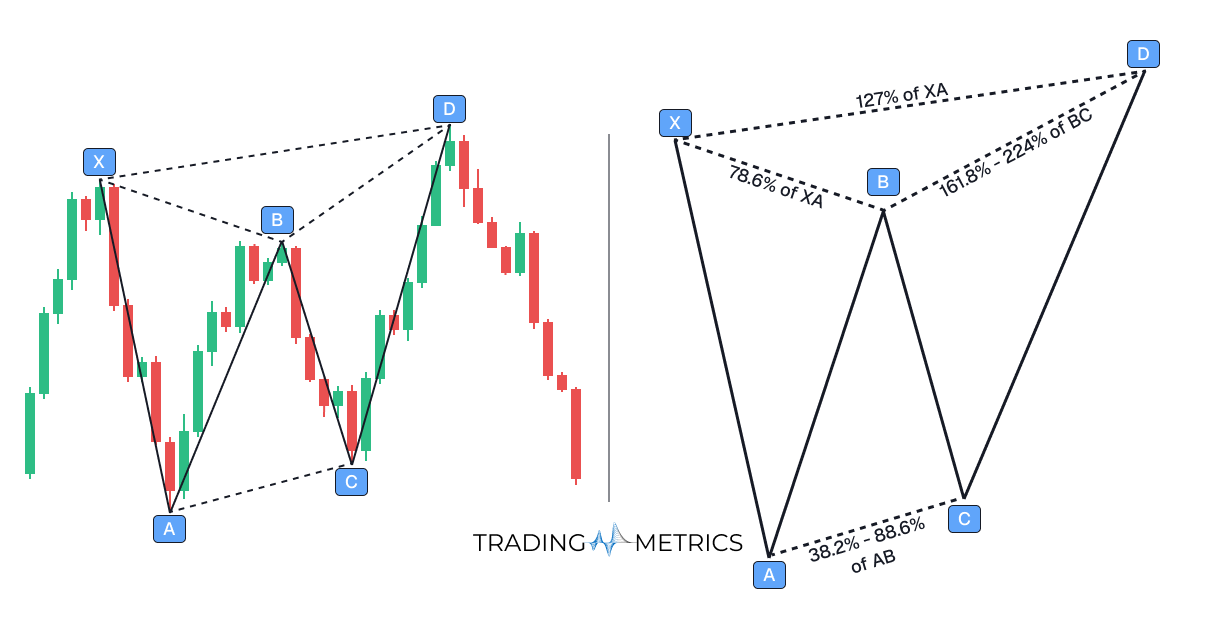
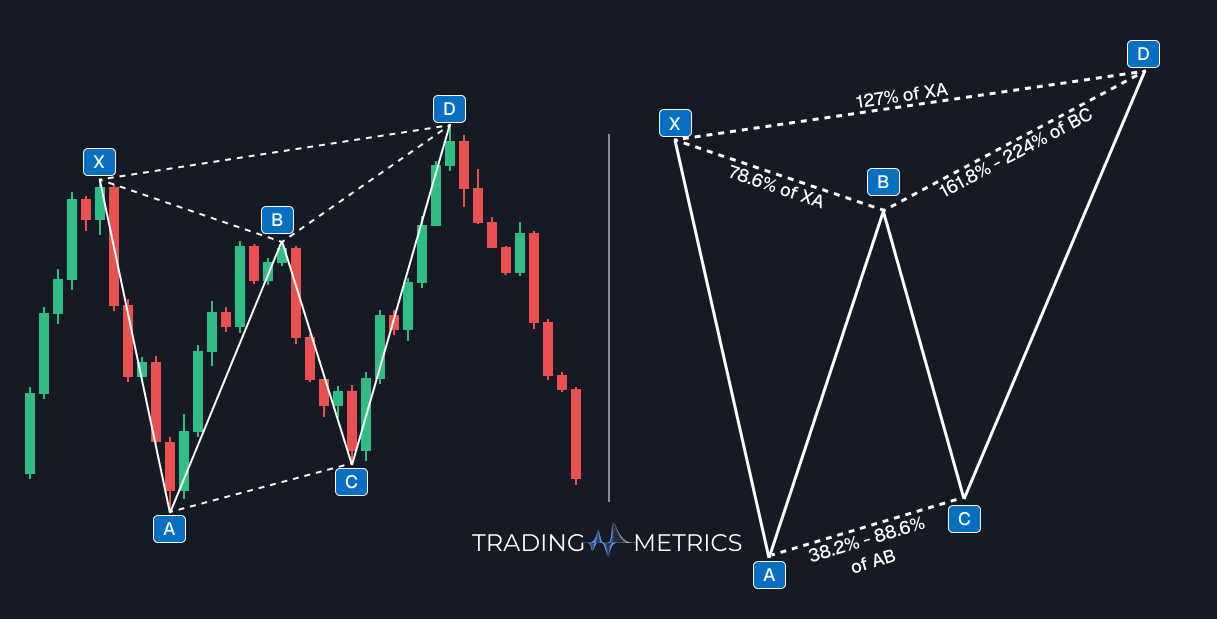
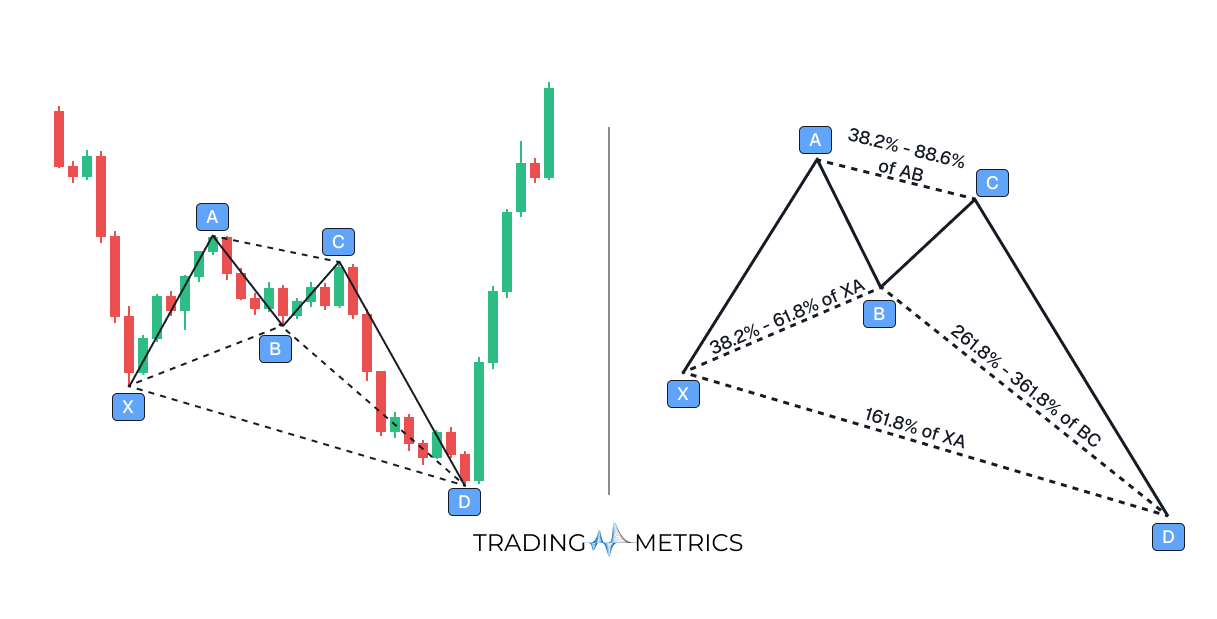
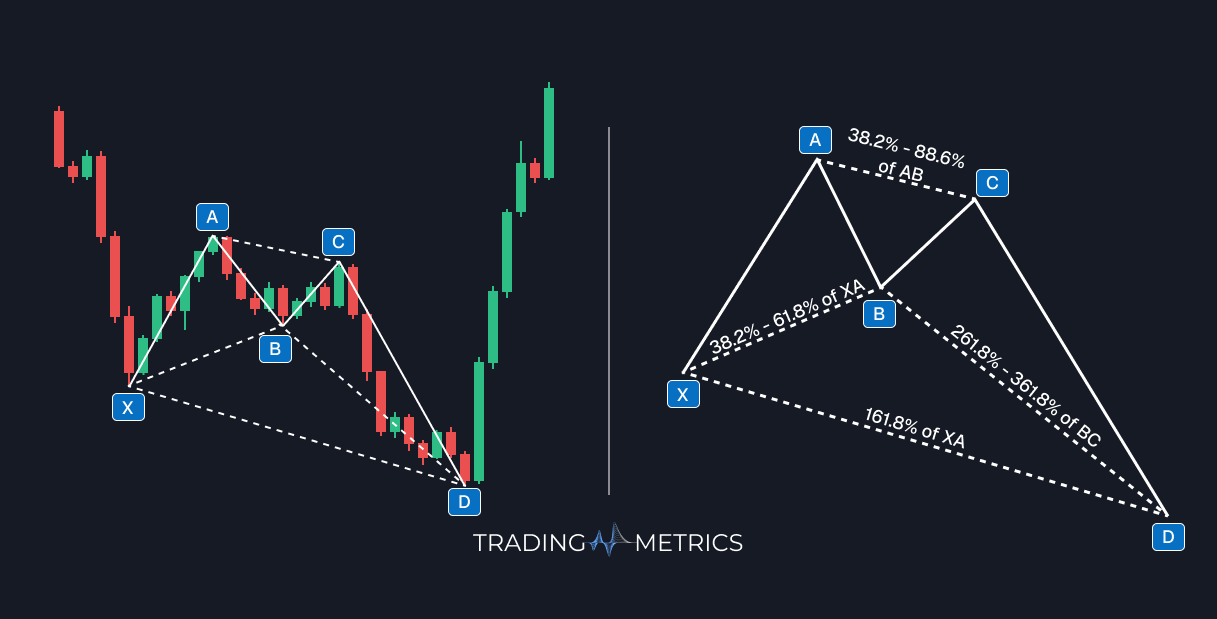
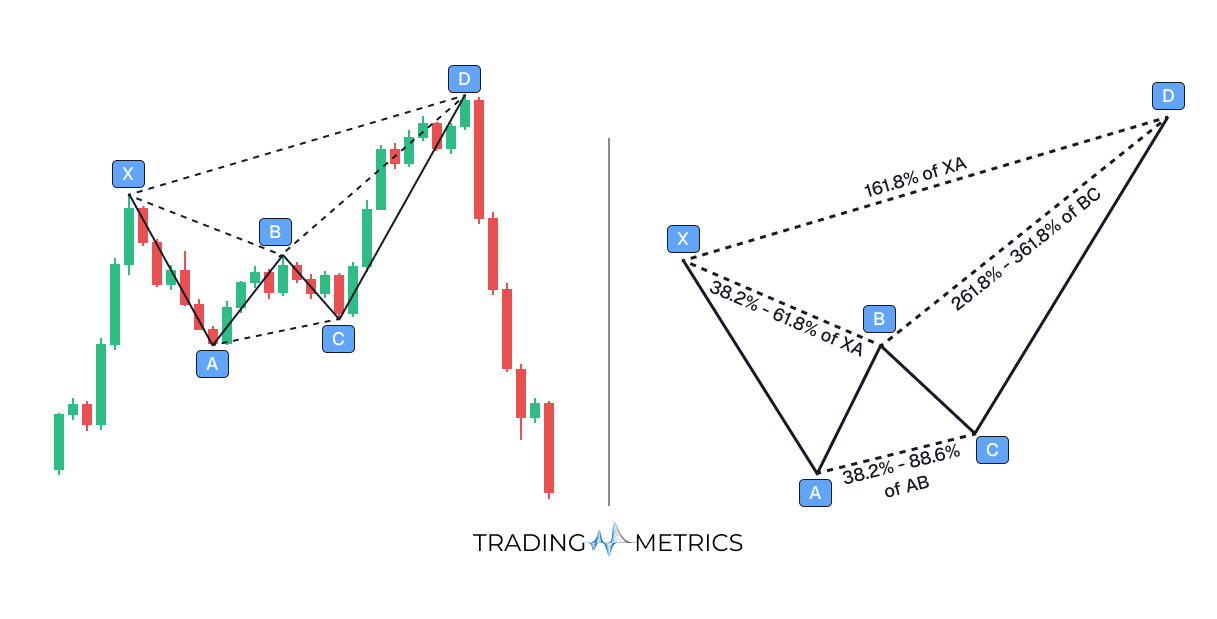
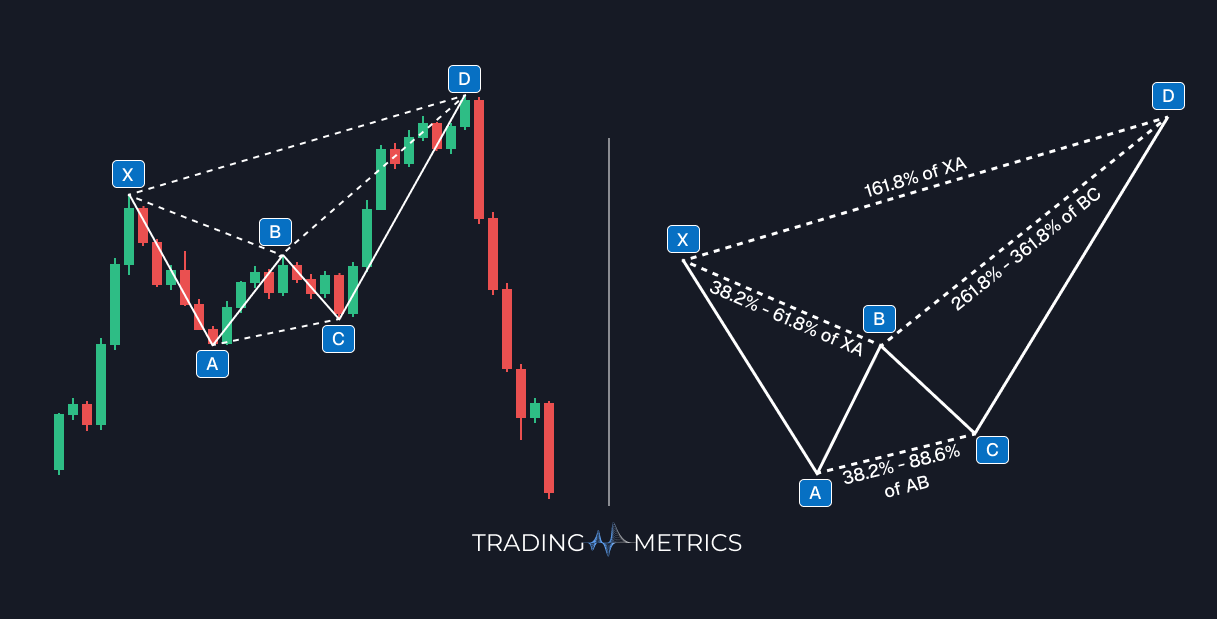
The Bullish Bat signals a strong upside reversal after a deep but measured retracement, while the Bearish Bat points to a sharp downside turn after an extended climb, both guided by strict Fibonacci Ratios.
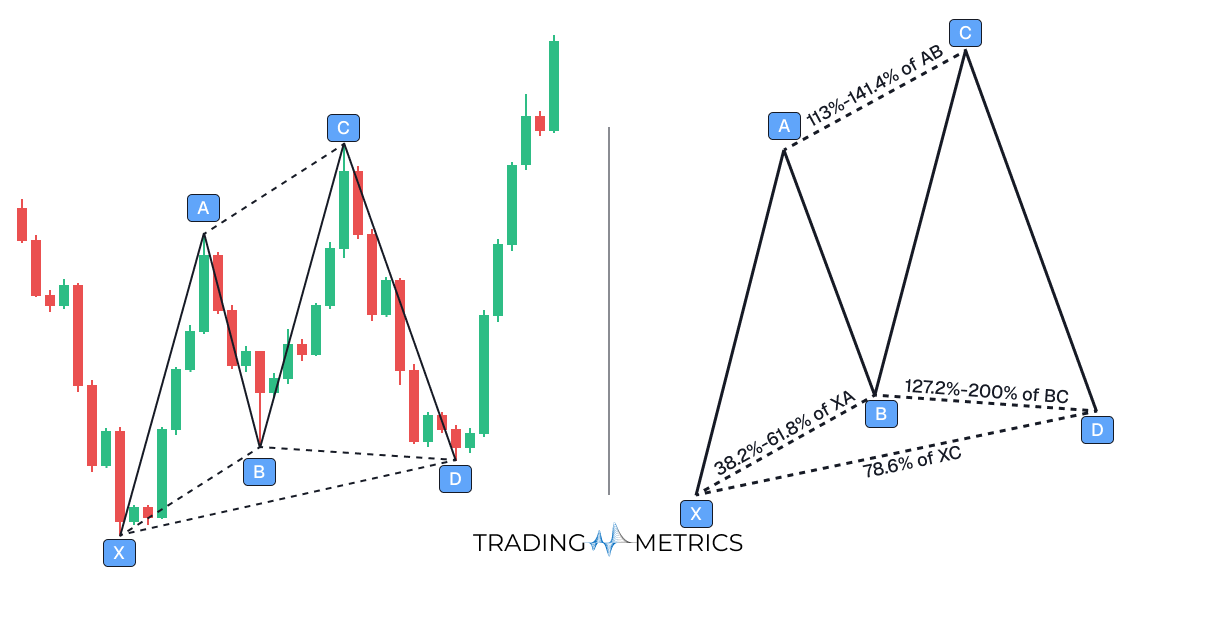
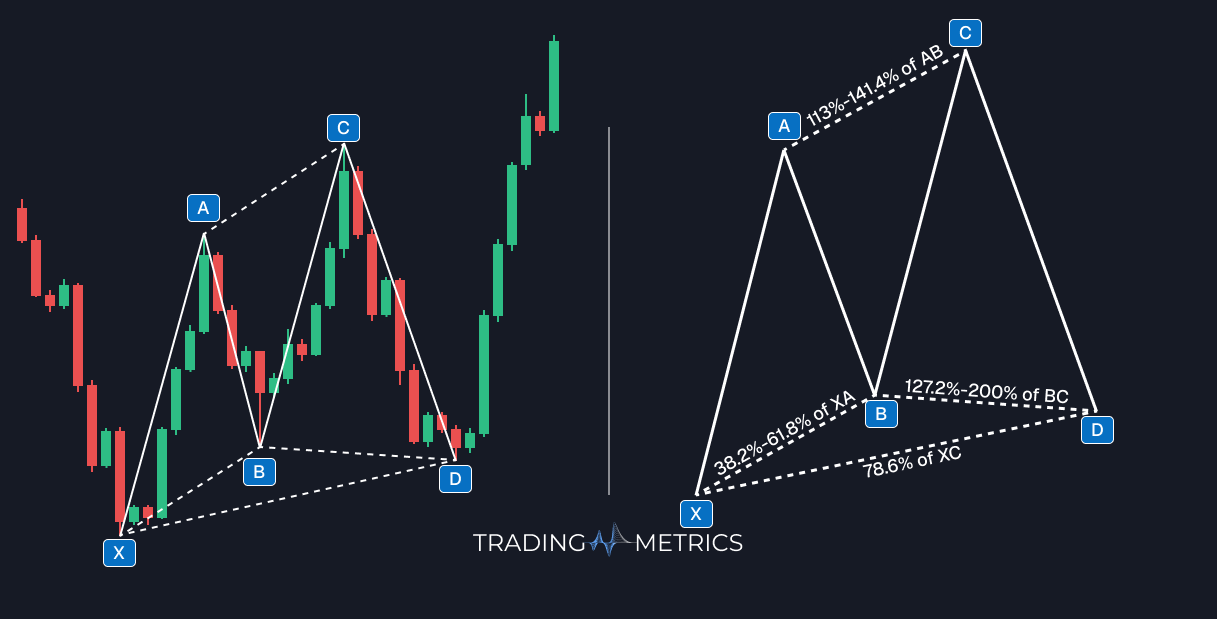
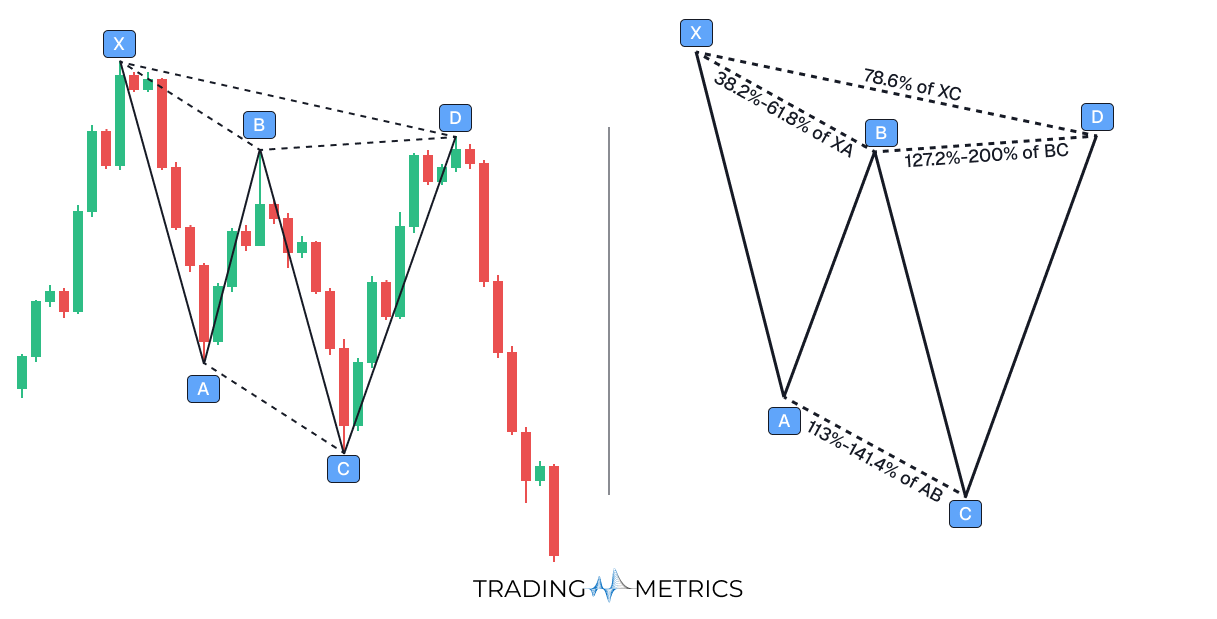
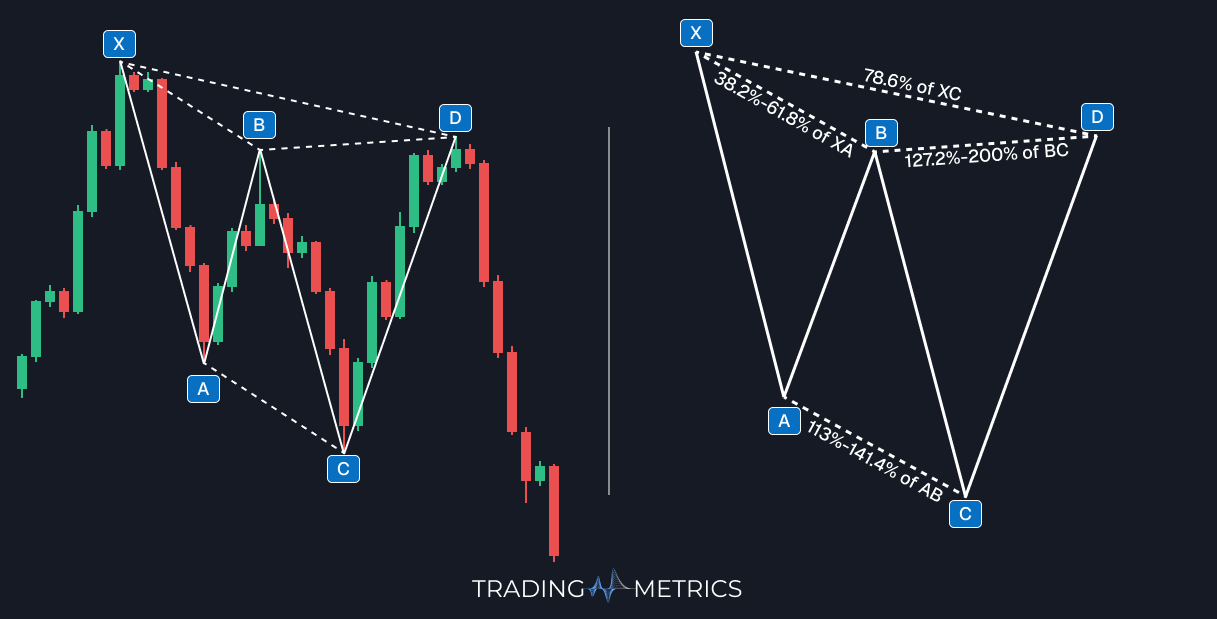
The Bullish Butterfly suggests a powerful rally after an extended decline, while the Bearish Butterfly signals a steep drop after a prolonged rise, both formed through precise Fibonacci extensions.
The Bullish Crab signals a sharp bullish reversal at an extreme Fibonacci extension, while the Bearish Crab warns of a strong bearish turn after an overextended rally, both defined by exact harmonic measurements.
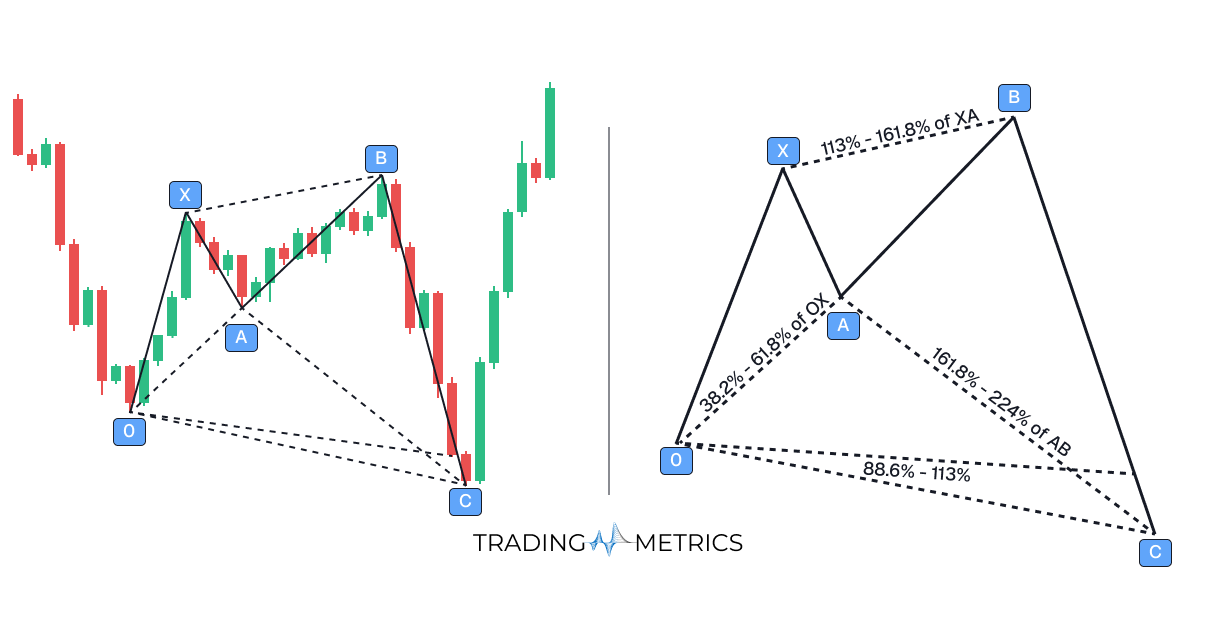
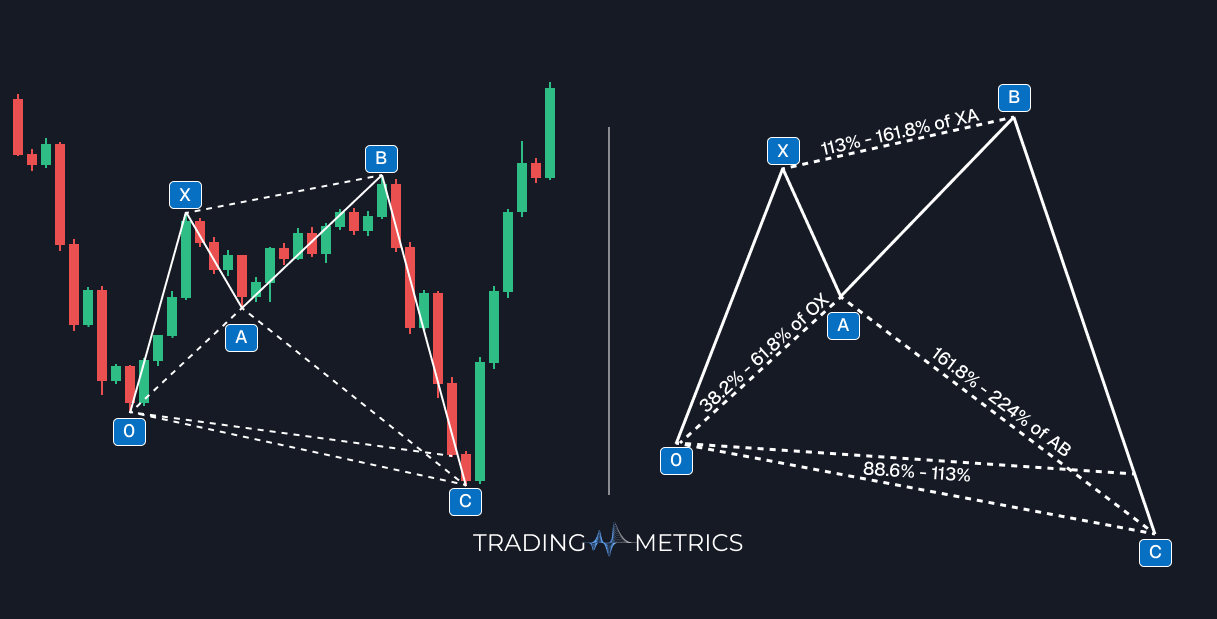
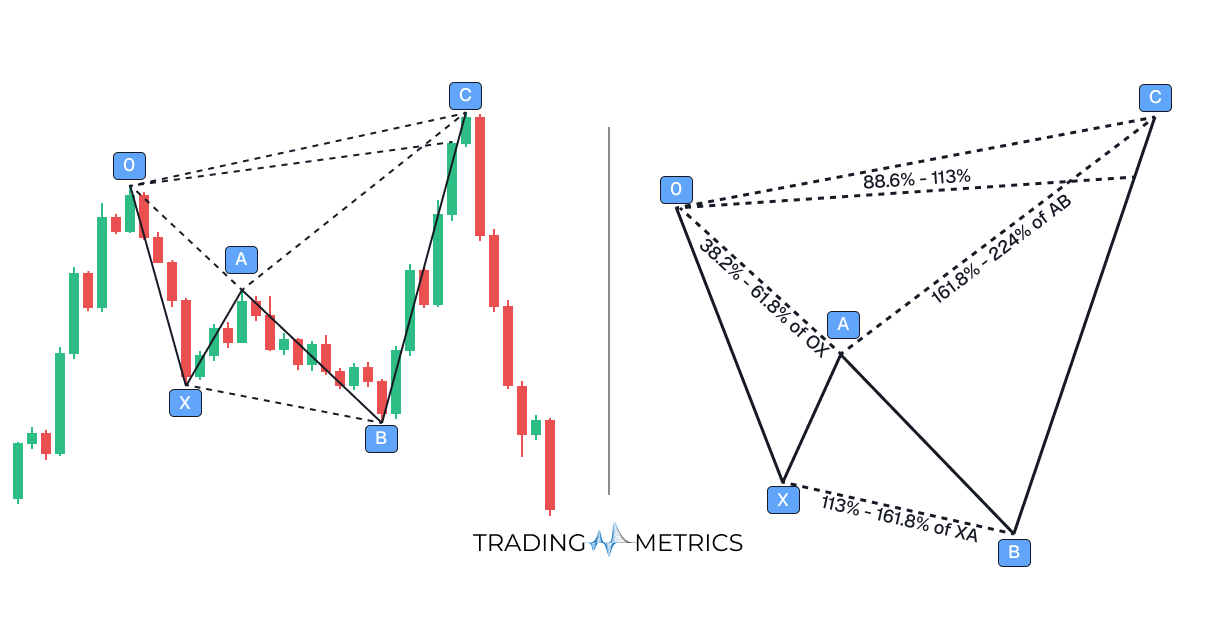
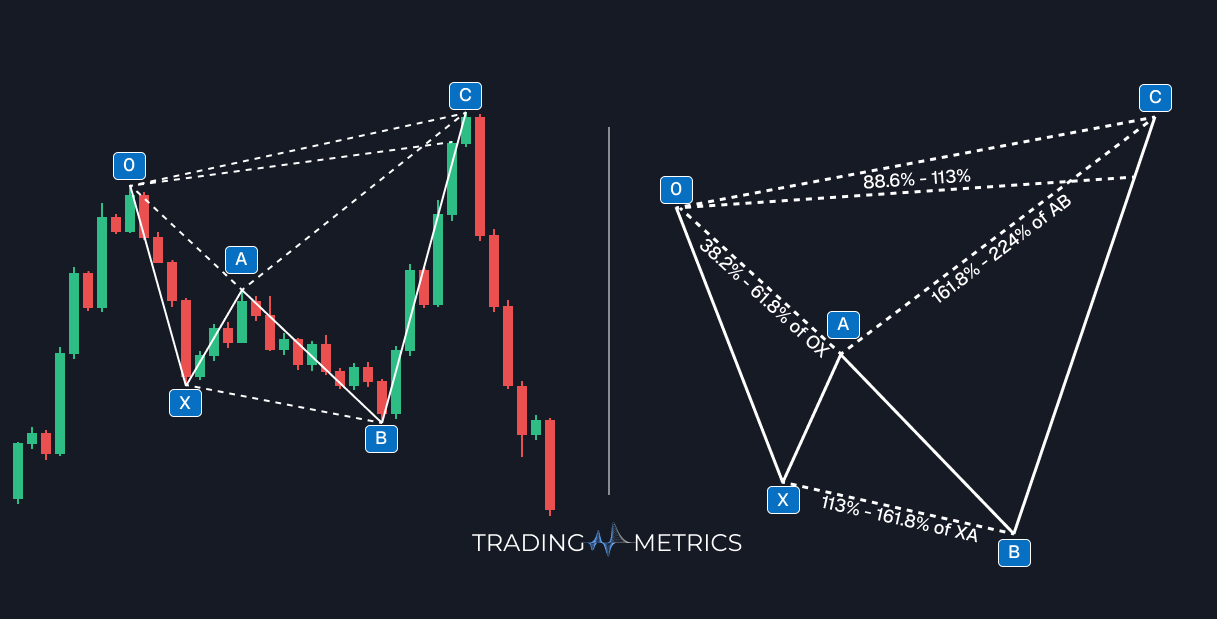
The Bullish Shark indicates a swift bullish reversal from an overextended drop, while the Bearish Shark signals a rapid bearish turn after an excessive rise, both shaped by unique Fibonacci projections.
The Bullish Cypher points to a quick bullish reversal after a sharp corrective move, while the Bearish Cypher signals a fast bearish turn following a steep rally, both structured by distinct Fibonacci patterns.
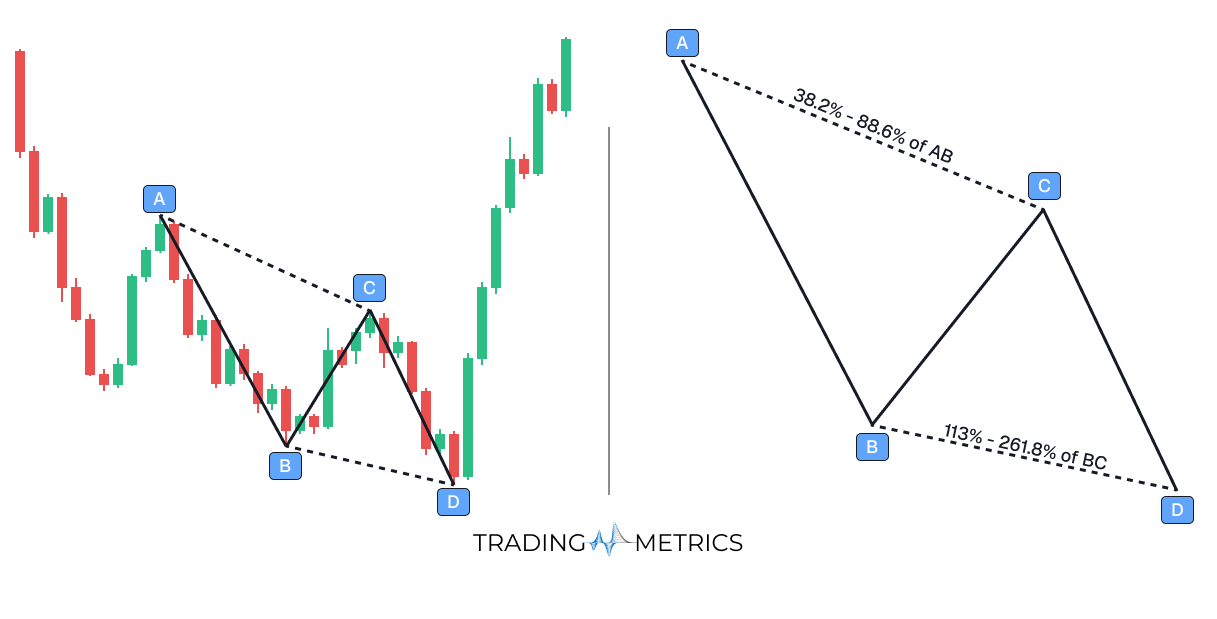
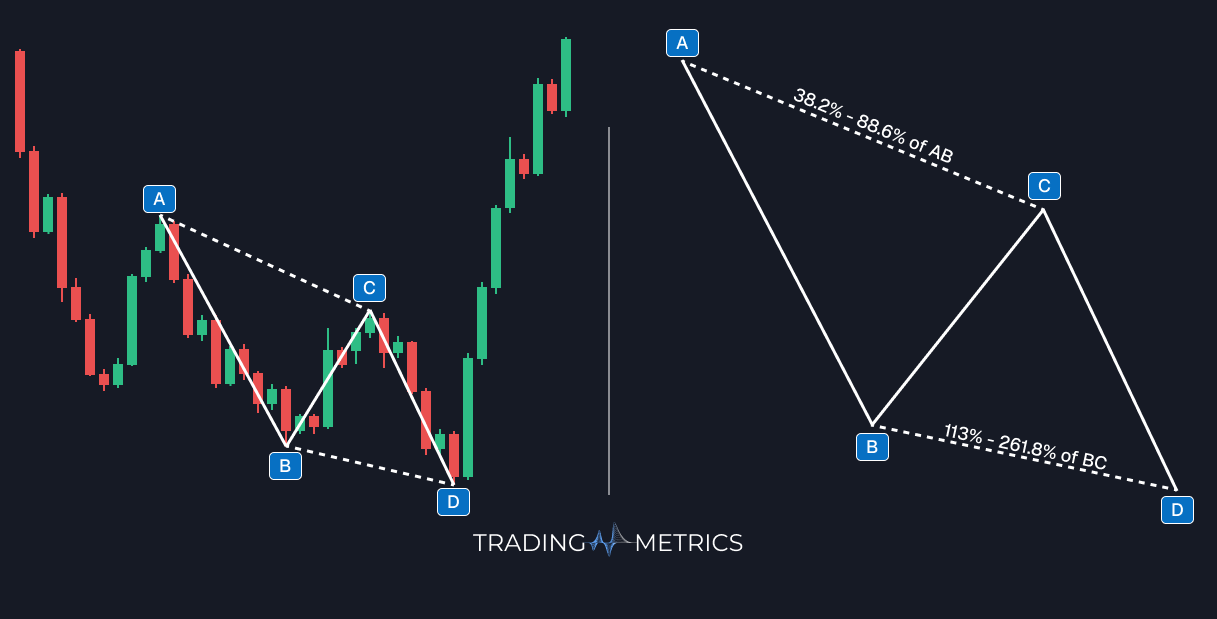
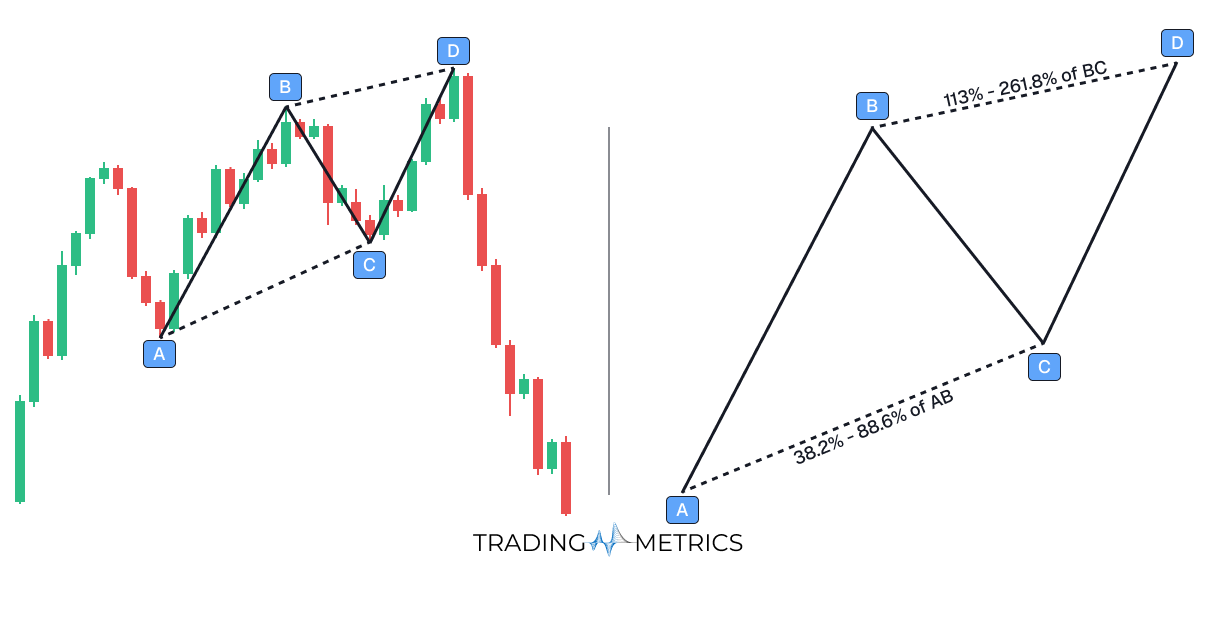
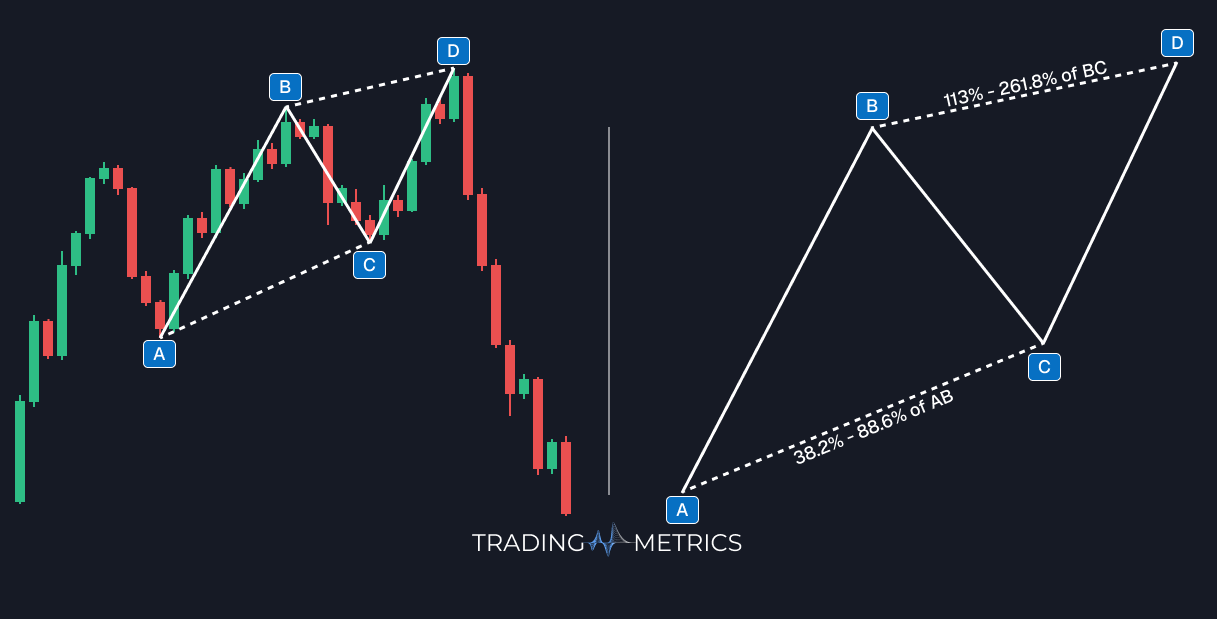
The Bullish AB=CD marks a likely bullish reversal as two equal price legs complete in harmony, while the Bearish AB=CD signals a potential bearish turn under the same symmetrical structure.
Frequently Asked Questions
Quick answers based on this page's topic.
Harmonic patterns, like the Gartley, Bat, or Butterfly, use specific Fibonacci ratios to identify geometric price structures. While standard patterns are more subjective, harmonics require precise mathematical alignment, offering highly specific zones for potential reversals known as 'PRZs' (Potential Reversal Zones).
A PRZ is an area where several Fibonacci levels from different legs of the harmonic pattern converge. When price enters this zone, traders look for secondary confirmation, such as a candlestick reversal pattern, to signal that the harmonic structure is completing and a reversal is beginning.
Harmonic patterns allow for extremely tight stop-losses because the trade is invalidated if the price moves beyond the specific Fibonacci threshold of the pattern. Because the targets are often at major retracement levels, the resulting Risk-Reward Ratio is frequently 1:3 or higher.