Trendlines: How to Draw Lines Price Actually Respects
Trendlines are one of the most fundamental tools in technical analysis, used to identify and confirm price trends in financial markets. They are drawn by connecting significant price points, such as highs or lows, to create a line that visually represents the direction of the trend. Upward trendlines indicate bullish momentum, while downward trendlines suggest bearish movement. By providing a clear visual guide, trendlines help traders spot potential reversal or continuation areas, improving decision-making.
In trading, trendlines are your map - they don’t guarantee the destination but guide the journey.
- Anonymous
How to Use Trend Lines?
To draw a trend line, you need to identify at least two or more significant swing points either highs or lows on the price chart. Here’s how to use them effectively:
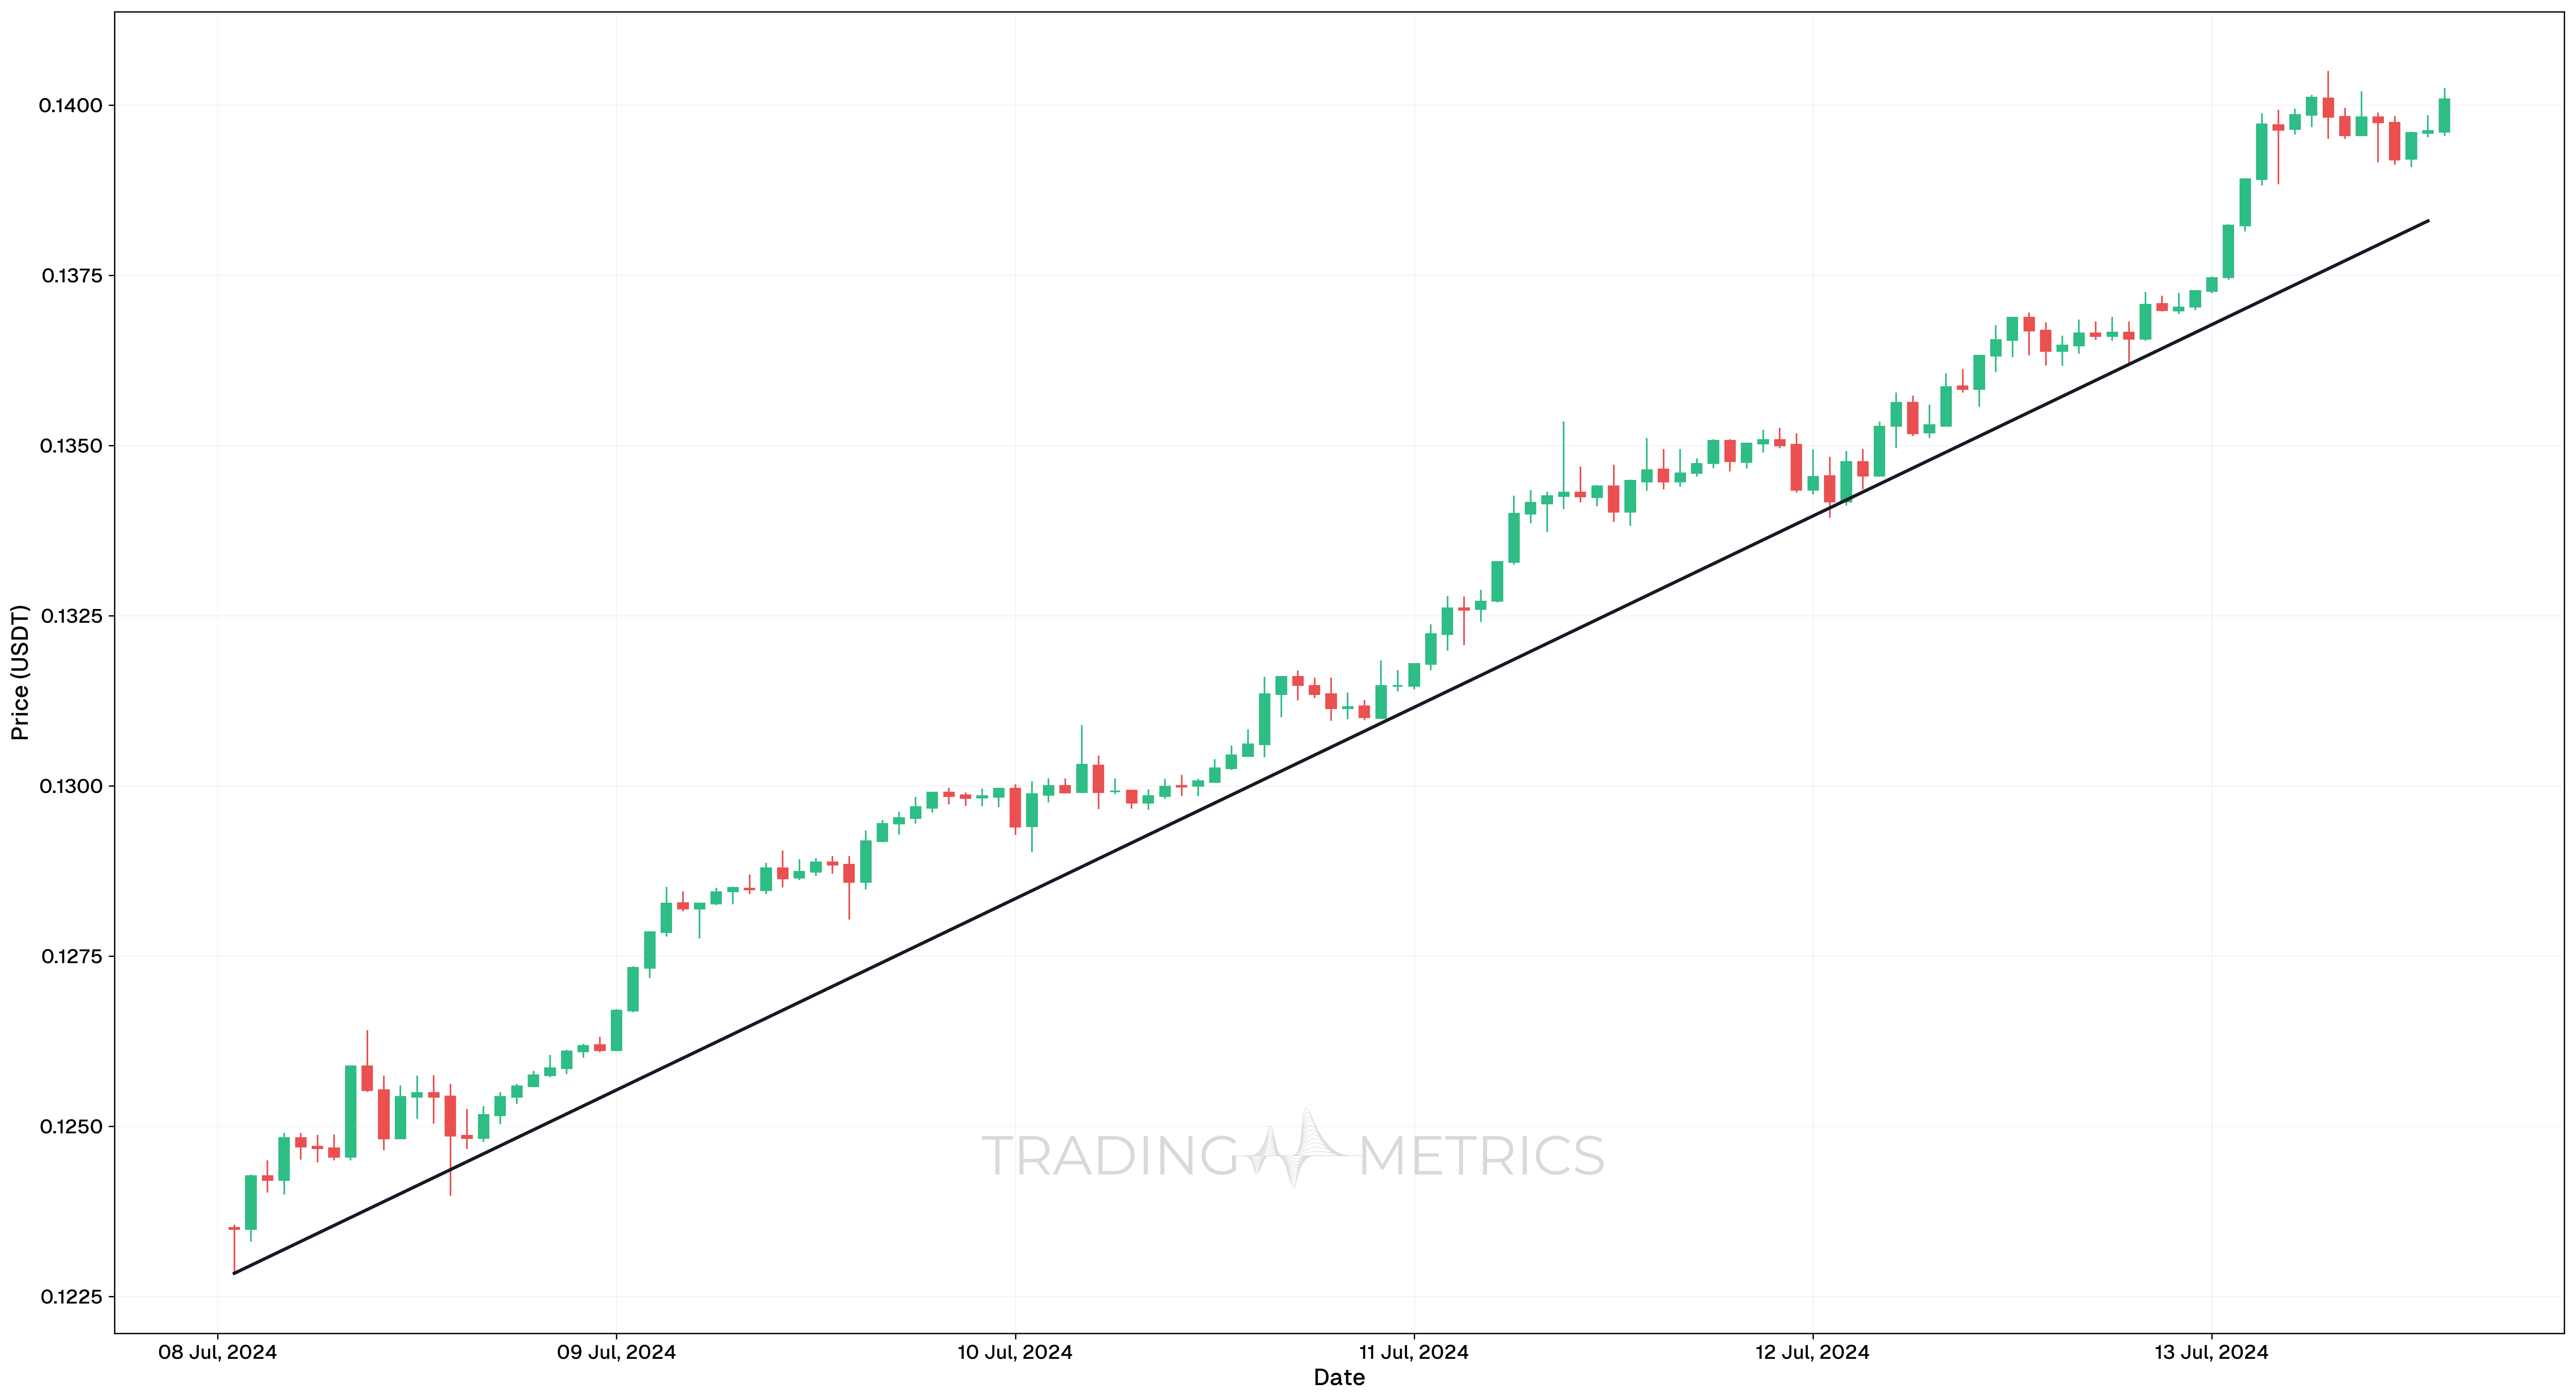
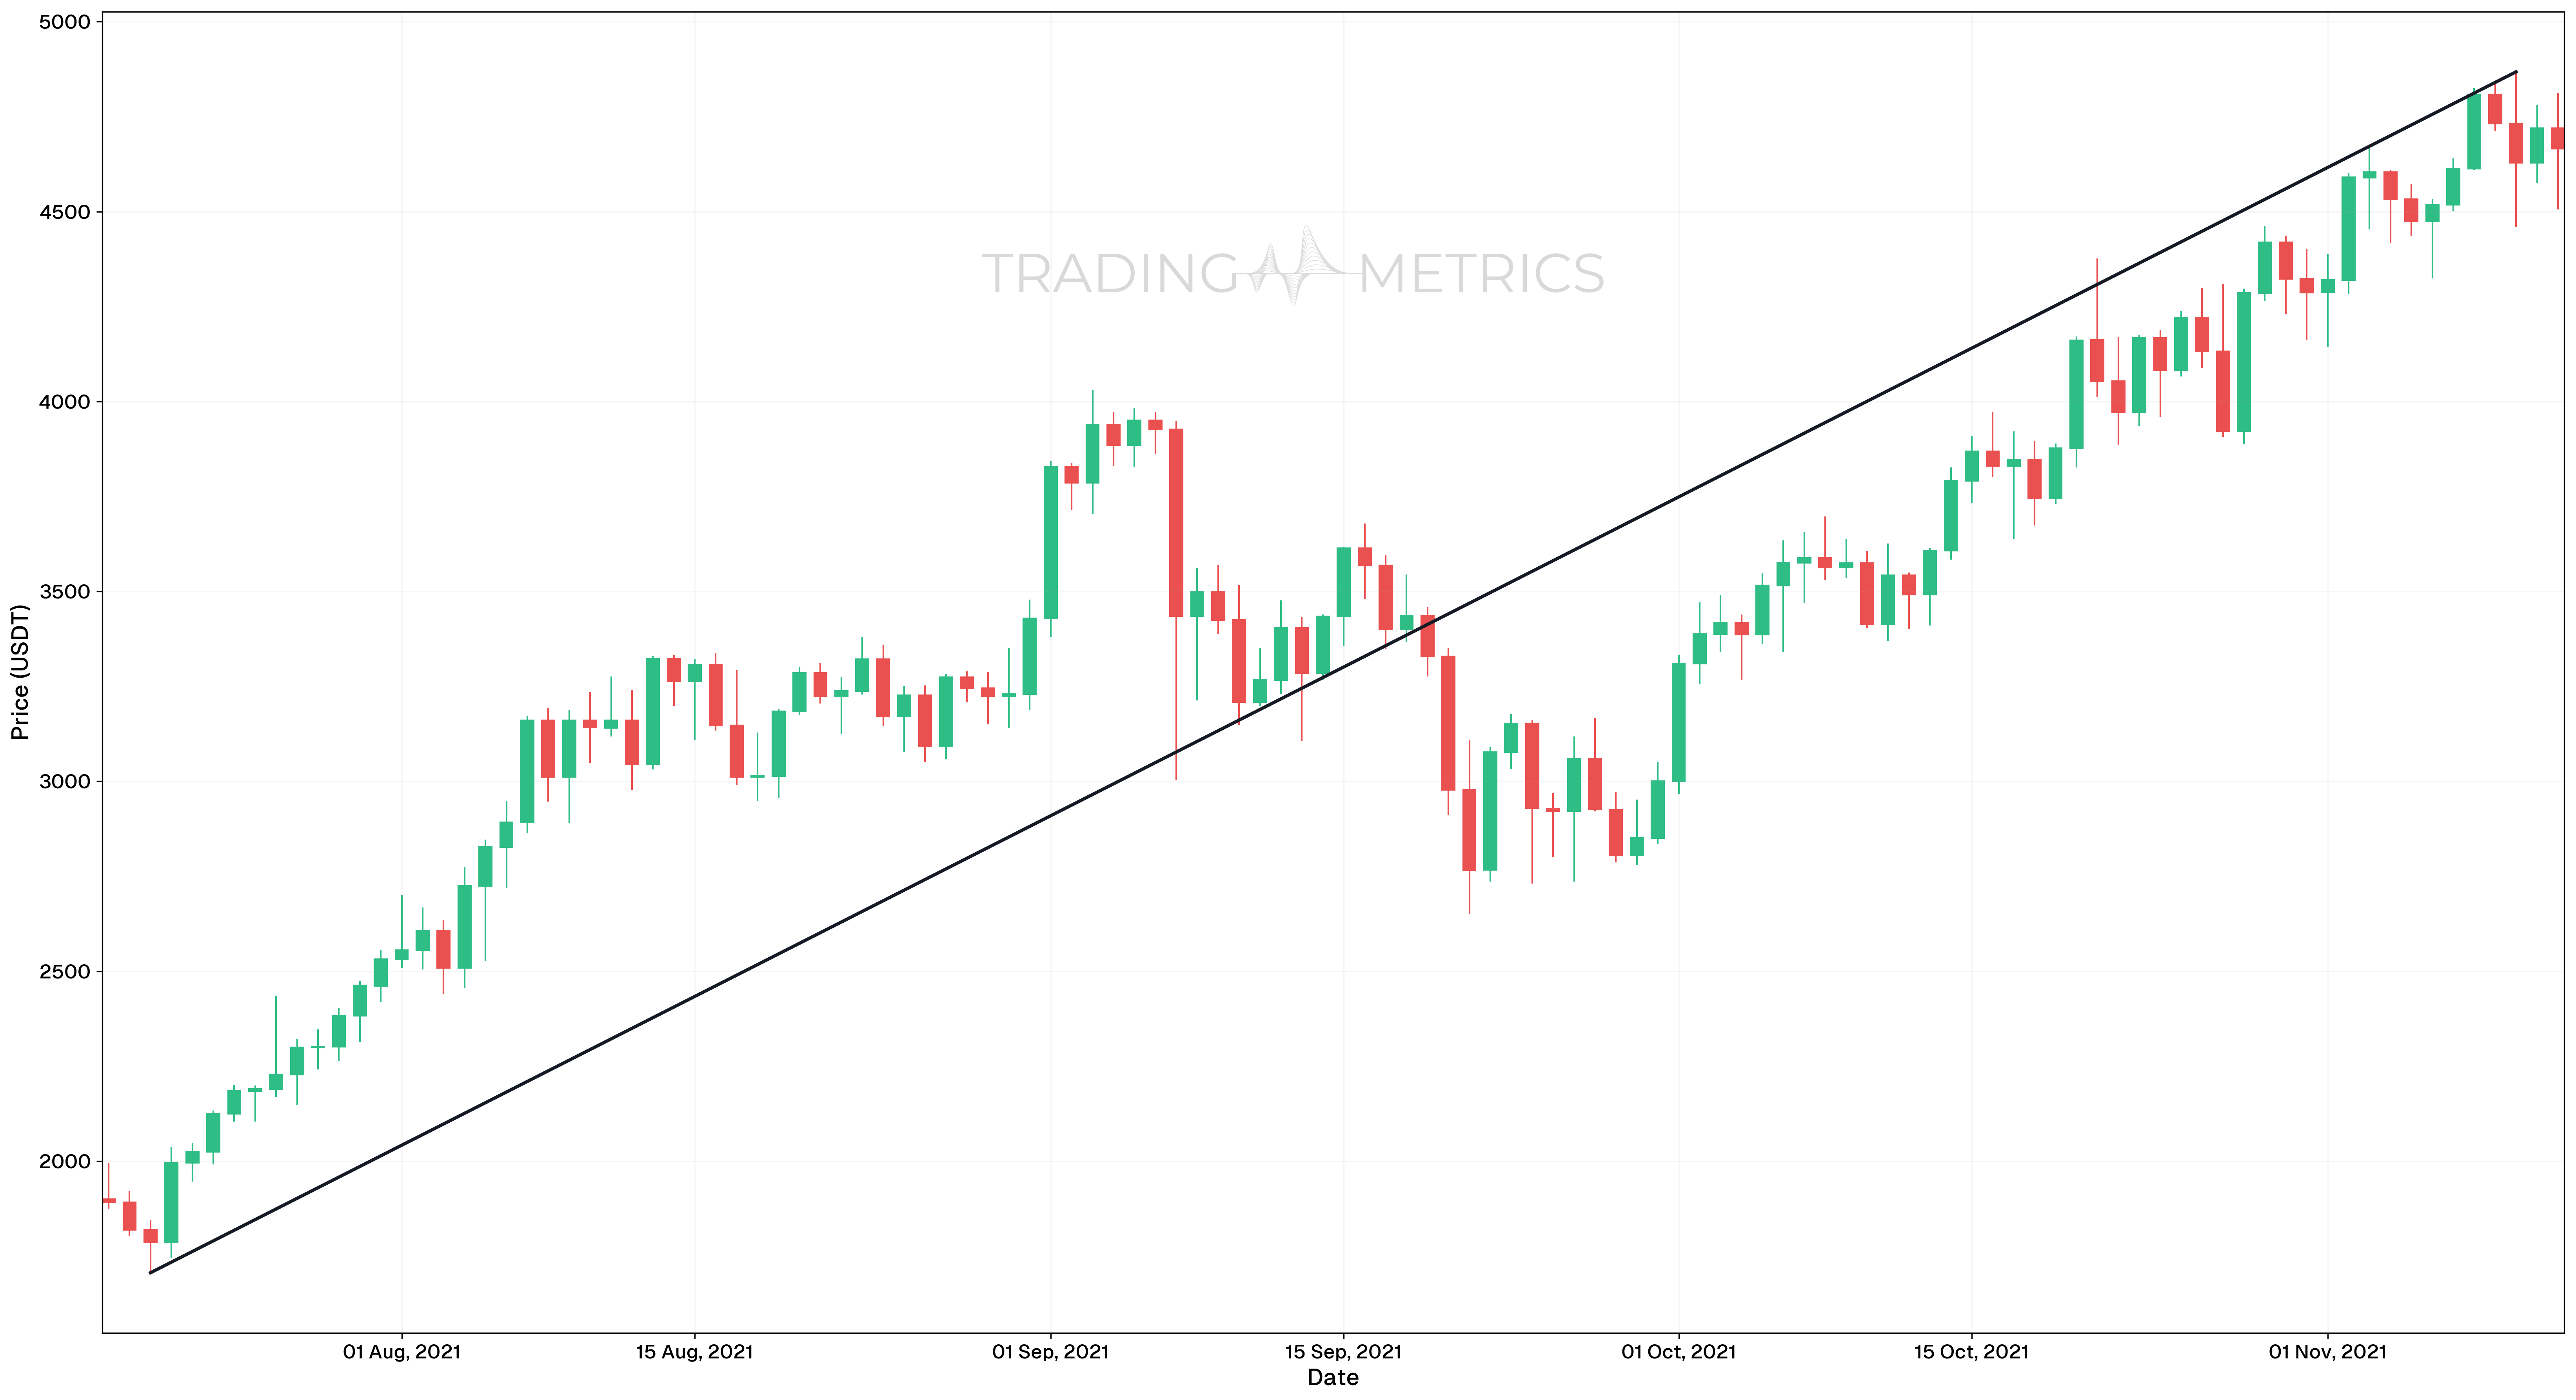
- Uptrend Line: Connect the lows during an upward movement. When the price approaches this line and bounces off, it confirms the support level, making it a potential buying opportunity.
- Downtrend Line: Connect the highs during a downward movement. When the price hits this line and fails to break through, it confirms resistance, indicating a potential selling point.
Visualize Trends: Trendlines provide a clear visual representation of the market’s direction, helping you identify uptrends, downtrends, and consolidations.
How to Draw Trend Lines?
Here’s a guide on how to draw trendlines effectively in trading:
Choose the Right Timeframe
Before drawing any trend line, decide the timeframe you want to analyze. A 1-hour chart is useful for short-term trading, while daily or weekly charts provide better insights for long-term trends.
Who should use it and when:
- For scalpers or day traders, shorter timeframes like 5-minute or 1-hour charts are ideal.
- For swing traders or position traders, daily or weekly charts provide a more stable picture of the trend.
Identify Major Highs and Lows
To draw a trend line, you need at least two significant points to connect:
- For an uptrend line, connect two or more lows (swing lows) to form a straight line. These lows should generally be higher than the previous low.
- For a downtrend line, connect two or more highs (swing highs) to form a straight line. These highs should generally be lower than the previous high.
Ensure Proper Slope
- An uptrend line should slope upward. The steeper the slope, the stronger the trend but beware of overly steep trend lines, as they can be more prone to breaking.
- A downtrend line should slope downward, with prices bouncing off the line from above.
Draw from Left to Right
Always draw your trend lines from left to right, as you are mapping out past price action to forecast future movements. Start at the first significant point (high or low) and extend the line toward more recent price points.
Adjust for Multiple Touch Points
The more times the price touches the trend line without breaking it, the stronger that line becomes. This gives you more confidence in its reliability. Adjust the line as needed to connect more points.
Uptrend VS Downtrend:
- For an uptrend, each time the price touches the line and bounces higher, it confirms the strength of the uptrend.
- For a downtrend, each time the price touches the line from below and falls further, the downtrend is validated.
Extend the Line
Trend lines can be extended into the future to anticipate future price interactions. This helps you identify potential breakout or bounce areas in advance.
Confirmation with Touches: The more times price respects a trendline, the stronger and more reliable it becomes for future analysis.
Importance of Trendlines in Trading
Trendlines are important for identifying the overall direction of a market, helping traders differentiate between bullish, bearish, and sideways trends. They provide visual clarity, making it easier to spot key levels of support and resistance, which are essential for planning trades. By analyzing price behavior around trendlines, traders can anticipate potential reversals or breakouts. Additionally, trendlines serve as a foundation for more advanced strategies, offering a simple yet powerful tool for improving trading decisions.
Combine with Other Tools: As mentioned, trend lines become even more powerful when used in conjunction with tools like Fibonacci Retracement, moving averages, and volume indicators.
Trend Lines Types
There are several types of trend lines traders use to analyze different kinds of market trends and price action. Each type serves a distinct purpose and helps to visualize the direction and strength of price movement. Let’s dive into the different kinds of trend lines:
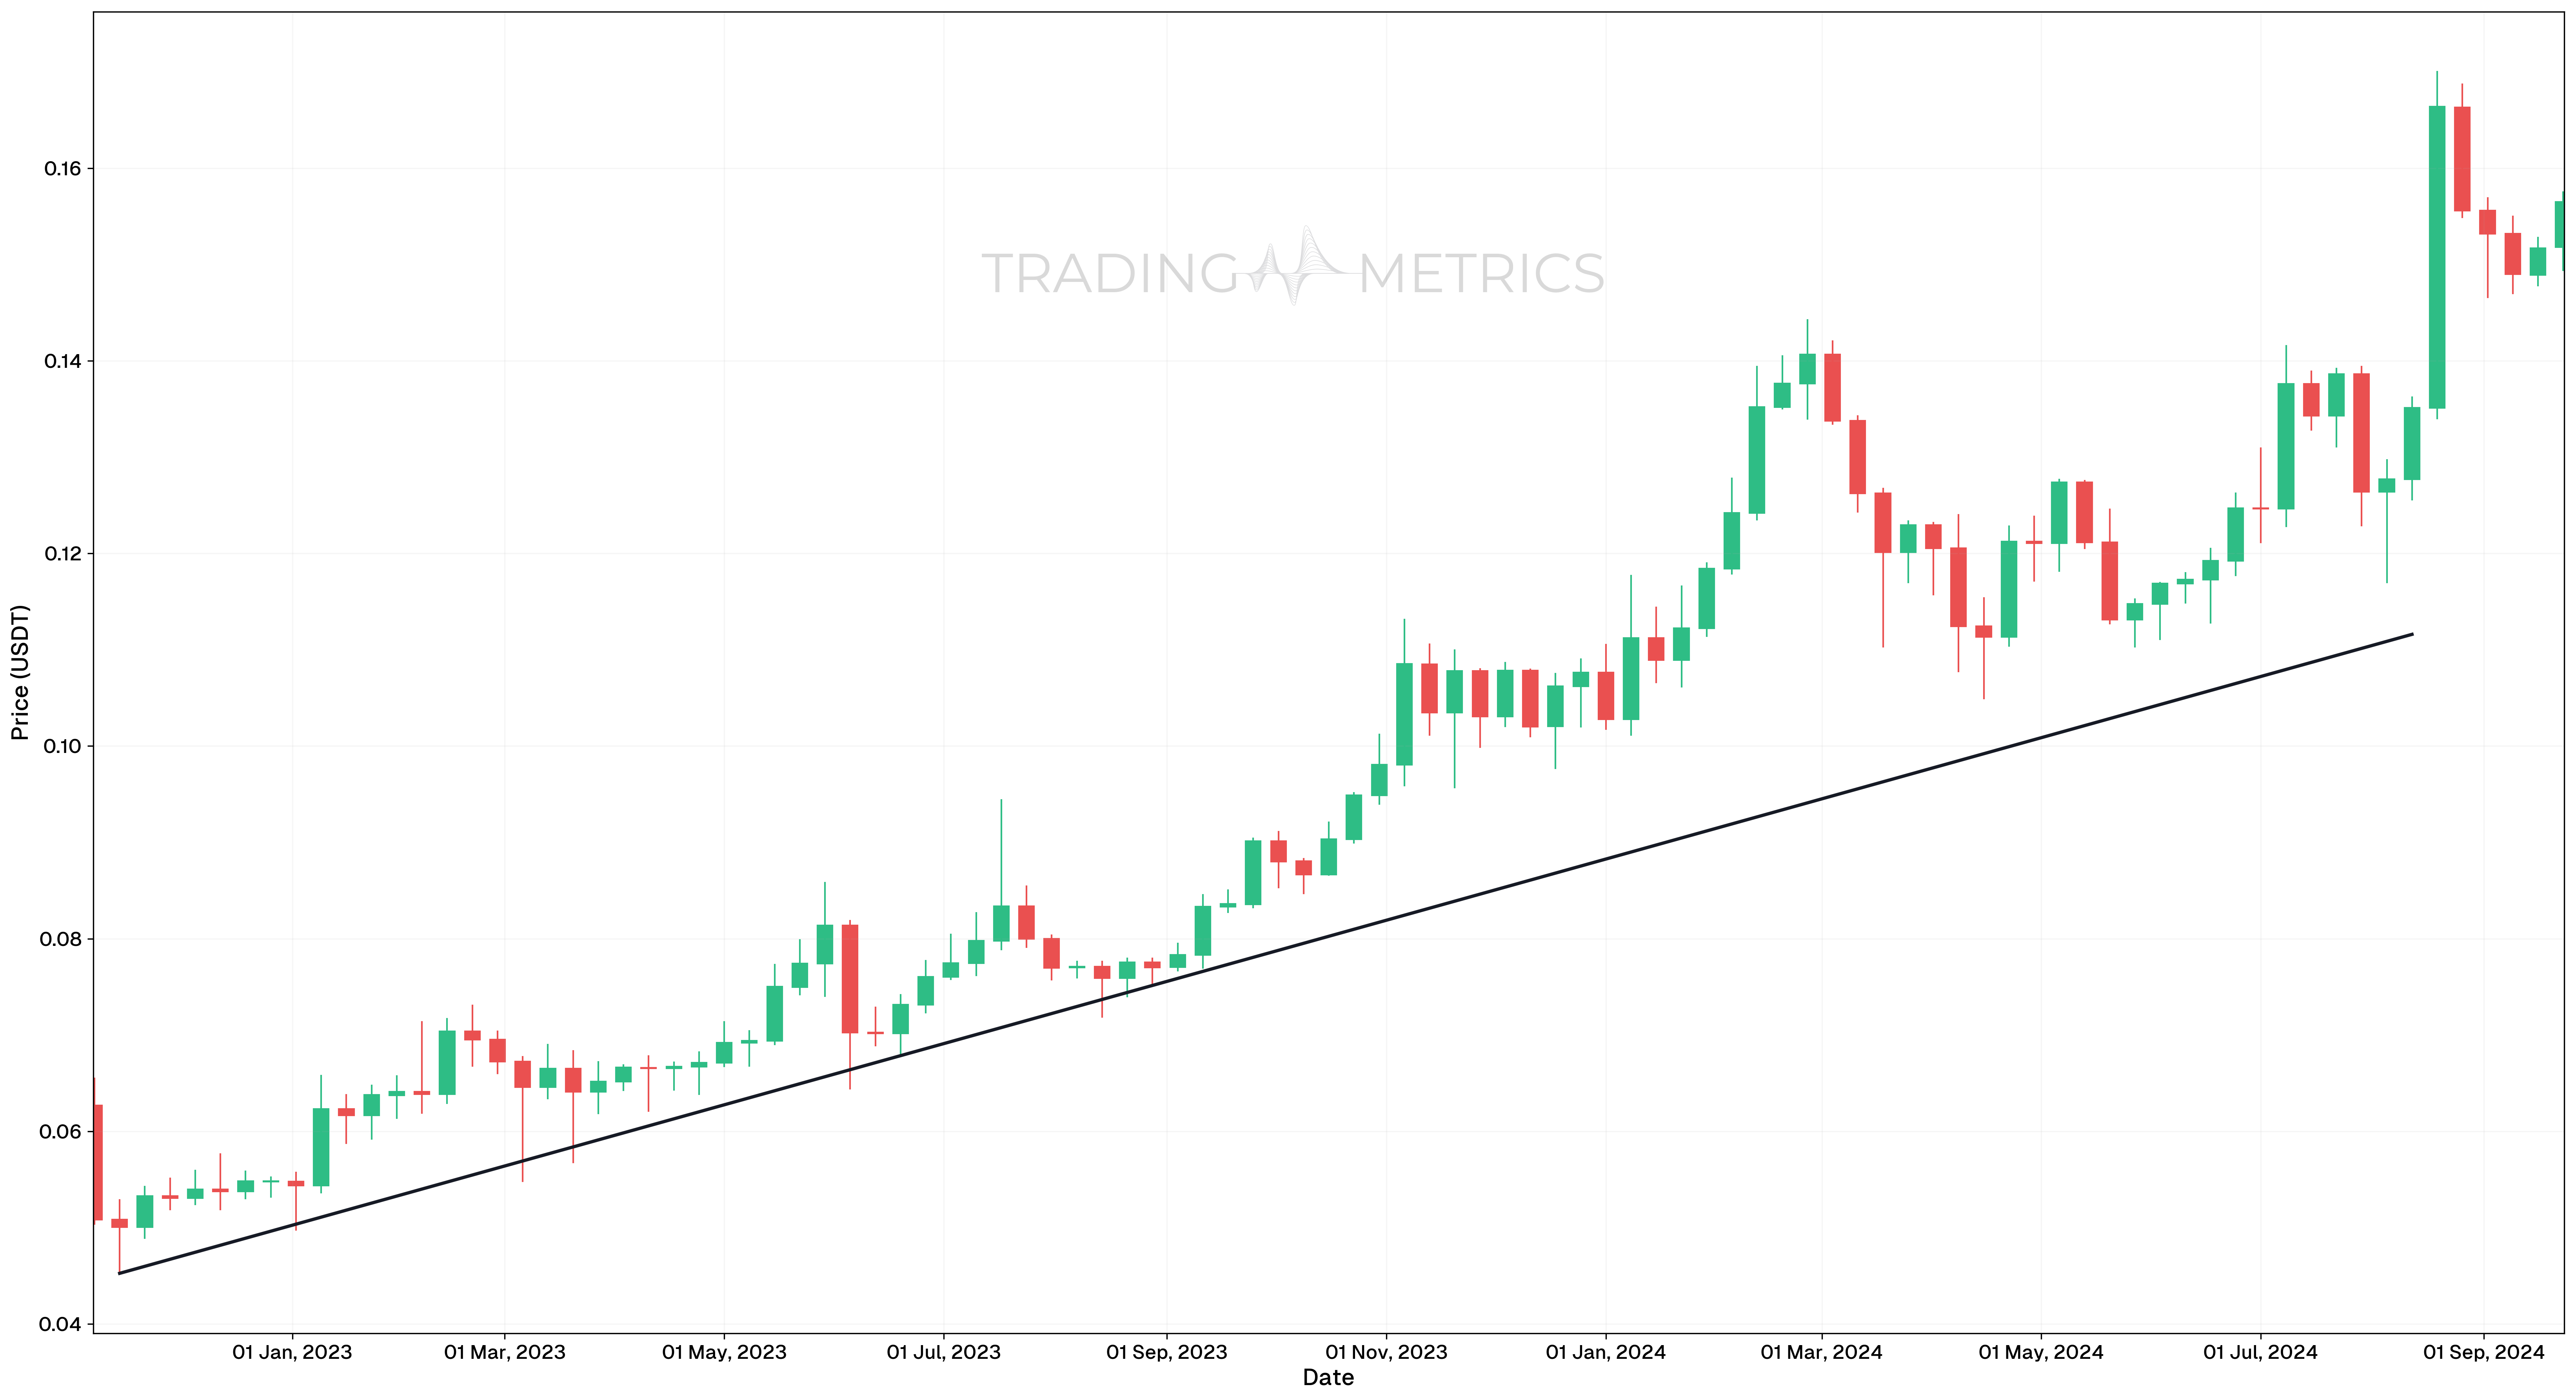
Uptrend Line (Ascending Trend Line)
An uptrend line connects a series of higher lows in an upward-sloping direction. It shows that the asset’s price is generally moving higher, with buyers stepping in at every pullback to push the price back up.
- How to Draw: Connect two or more higher lows (bottoms) on the price chart.
- What It Indicates: The market is in an uptrend, where buyers are in control, and the price tends to bounce higher from the trend line.
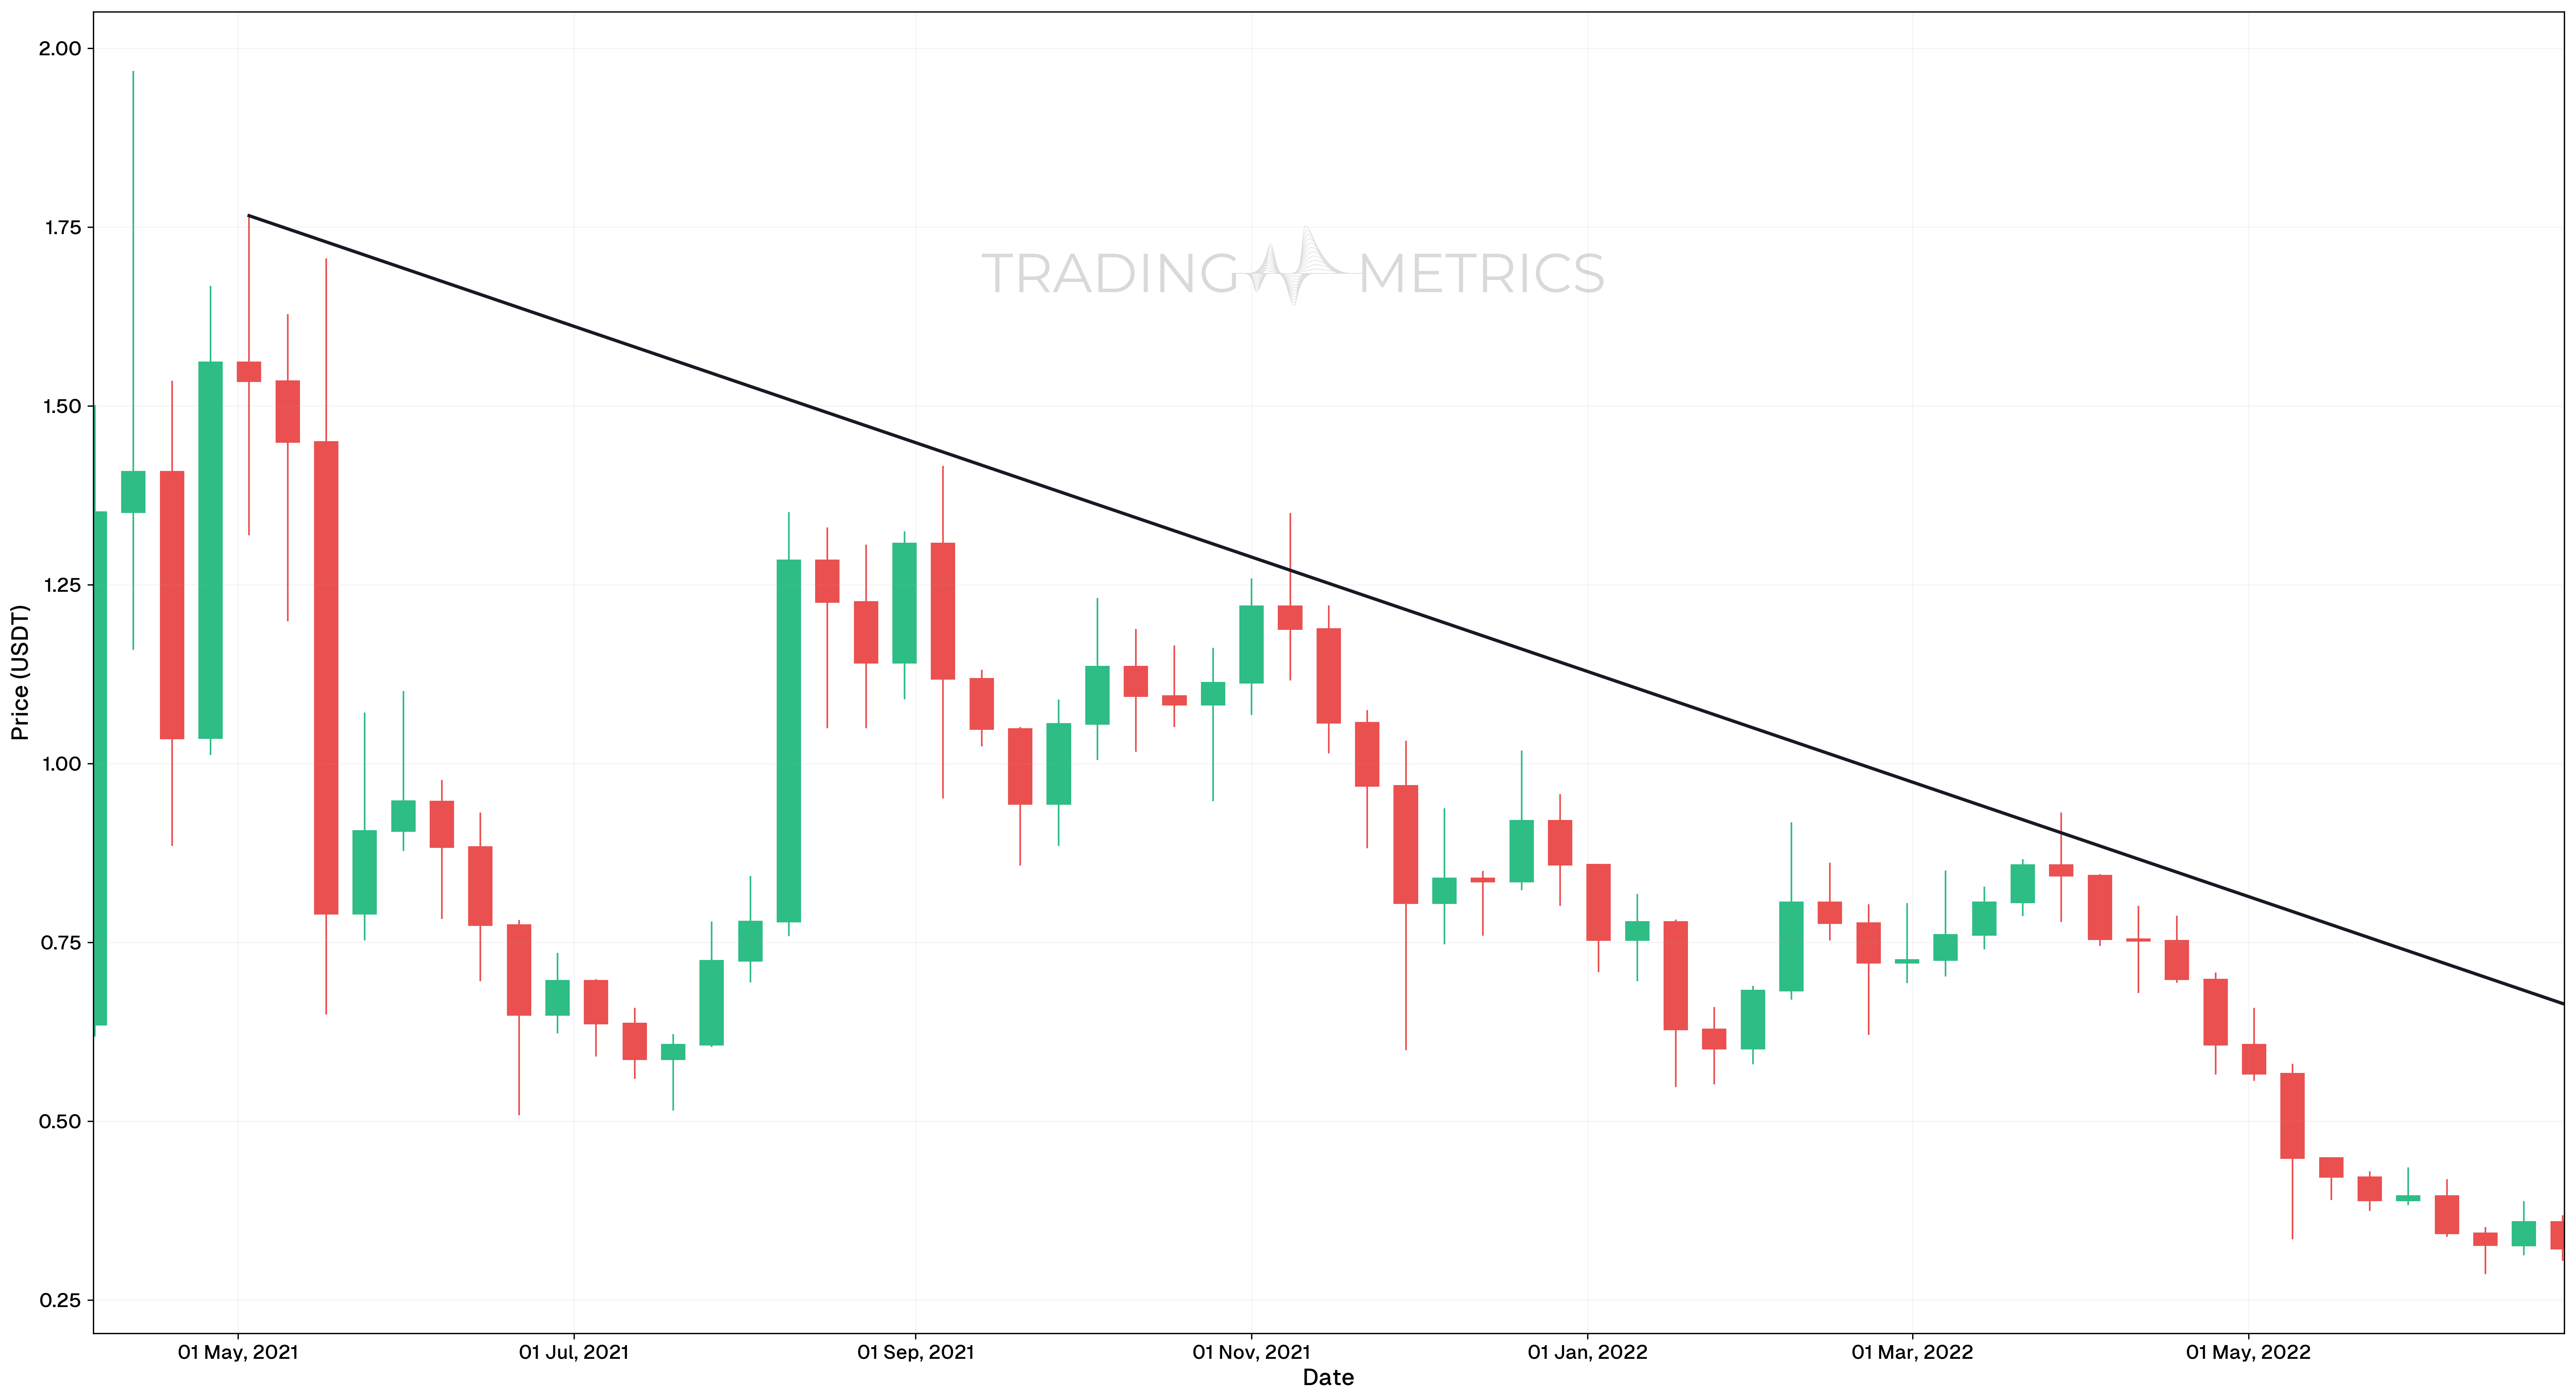
Downtrend Line (Descending Trend Line)
A downtrend line connects a series of lower highs in a downward-sloping direction. This indicates that the asset’s price is trending lower, with sellers controlling the market, pushing the price down after every rally.
- How to Draw: Connect two or more lower highs (peaks) on the price chart.
- What It Indicates: The market is in a downtrend, meaning selling pressure is strong, and the price tends to fall after hitting the trend line.
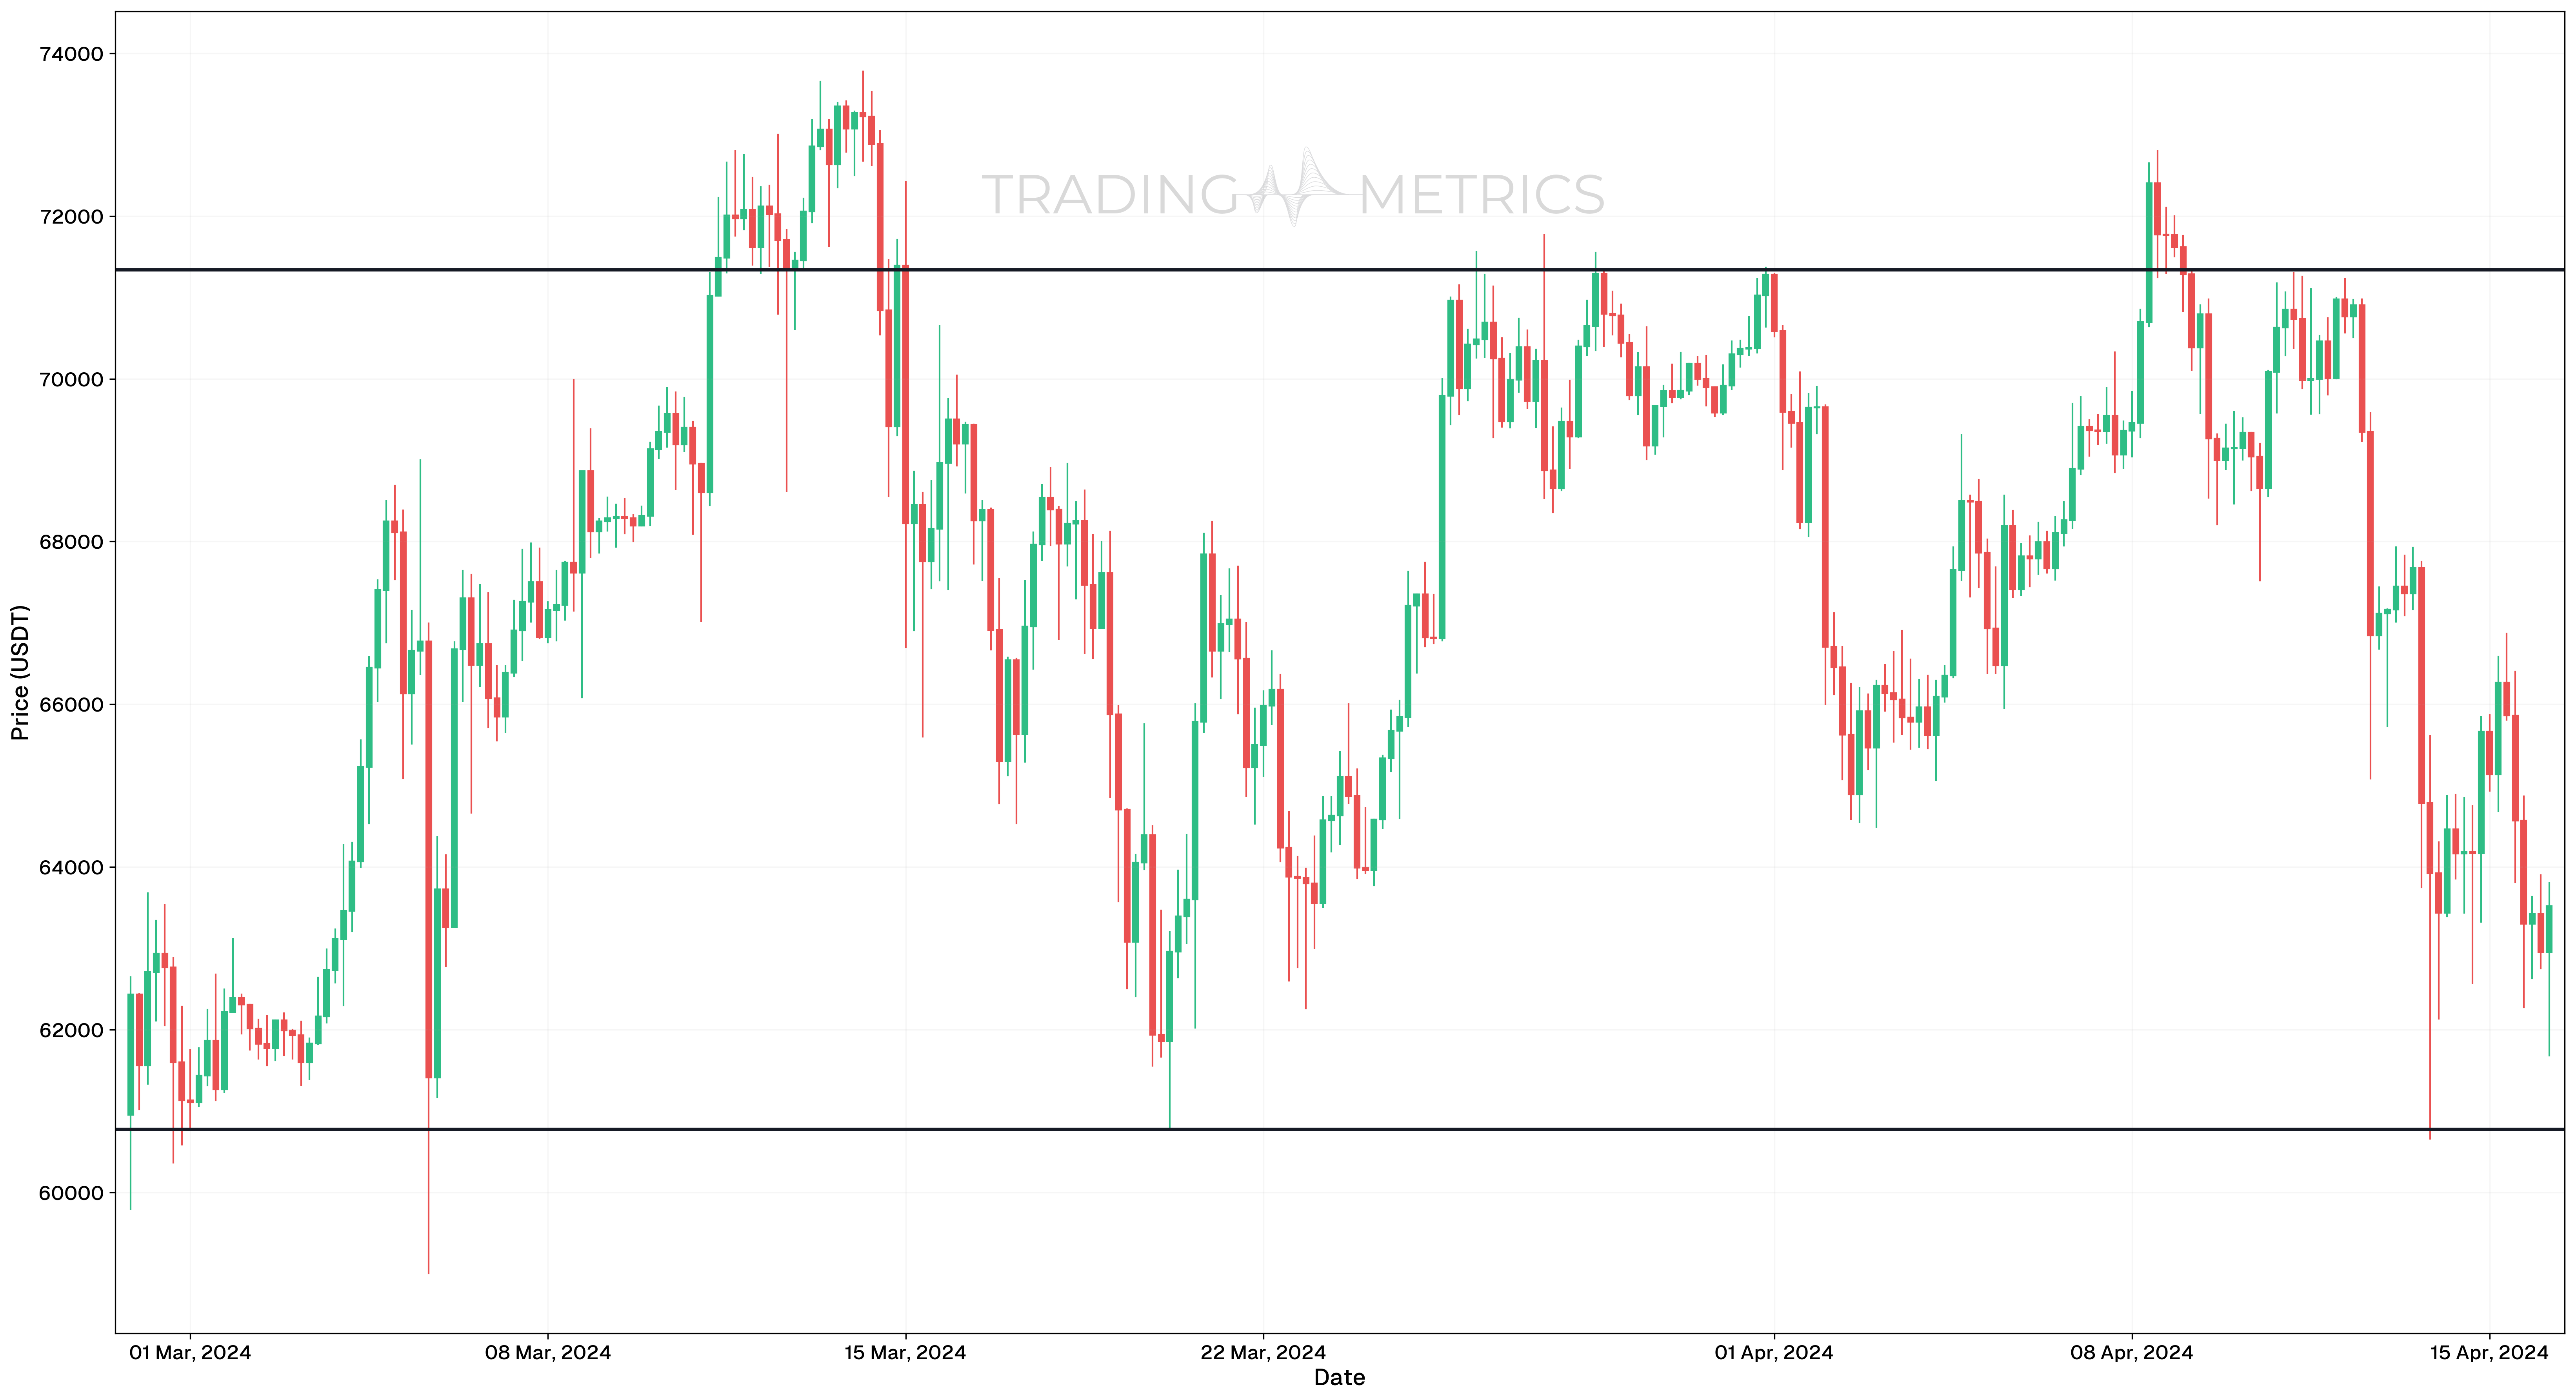
Horizontal Trend Line (Sideways or Flat Trend Line)
A horizontal trend line runs parallel to the x-axis, showing that the price is moving sideways. These lines can act as support or resistance levels, depending on whether the price is bouncing off from below (support) or struggling to break through from above (resistance).
- How to Draw: Draw a straight line through two or more highs (resistance) or lows (support) that are at approximately the same price level.
- What It Indicates: The market is in a range or consolidation, with neither buyers nor sellers having clear control.
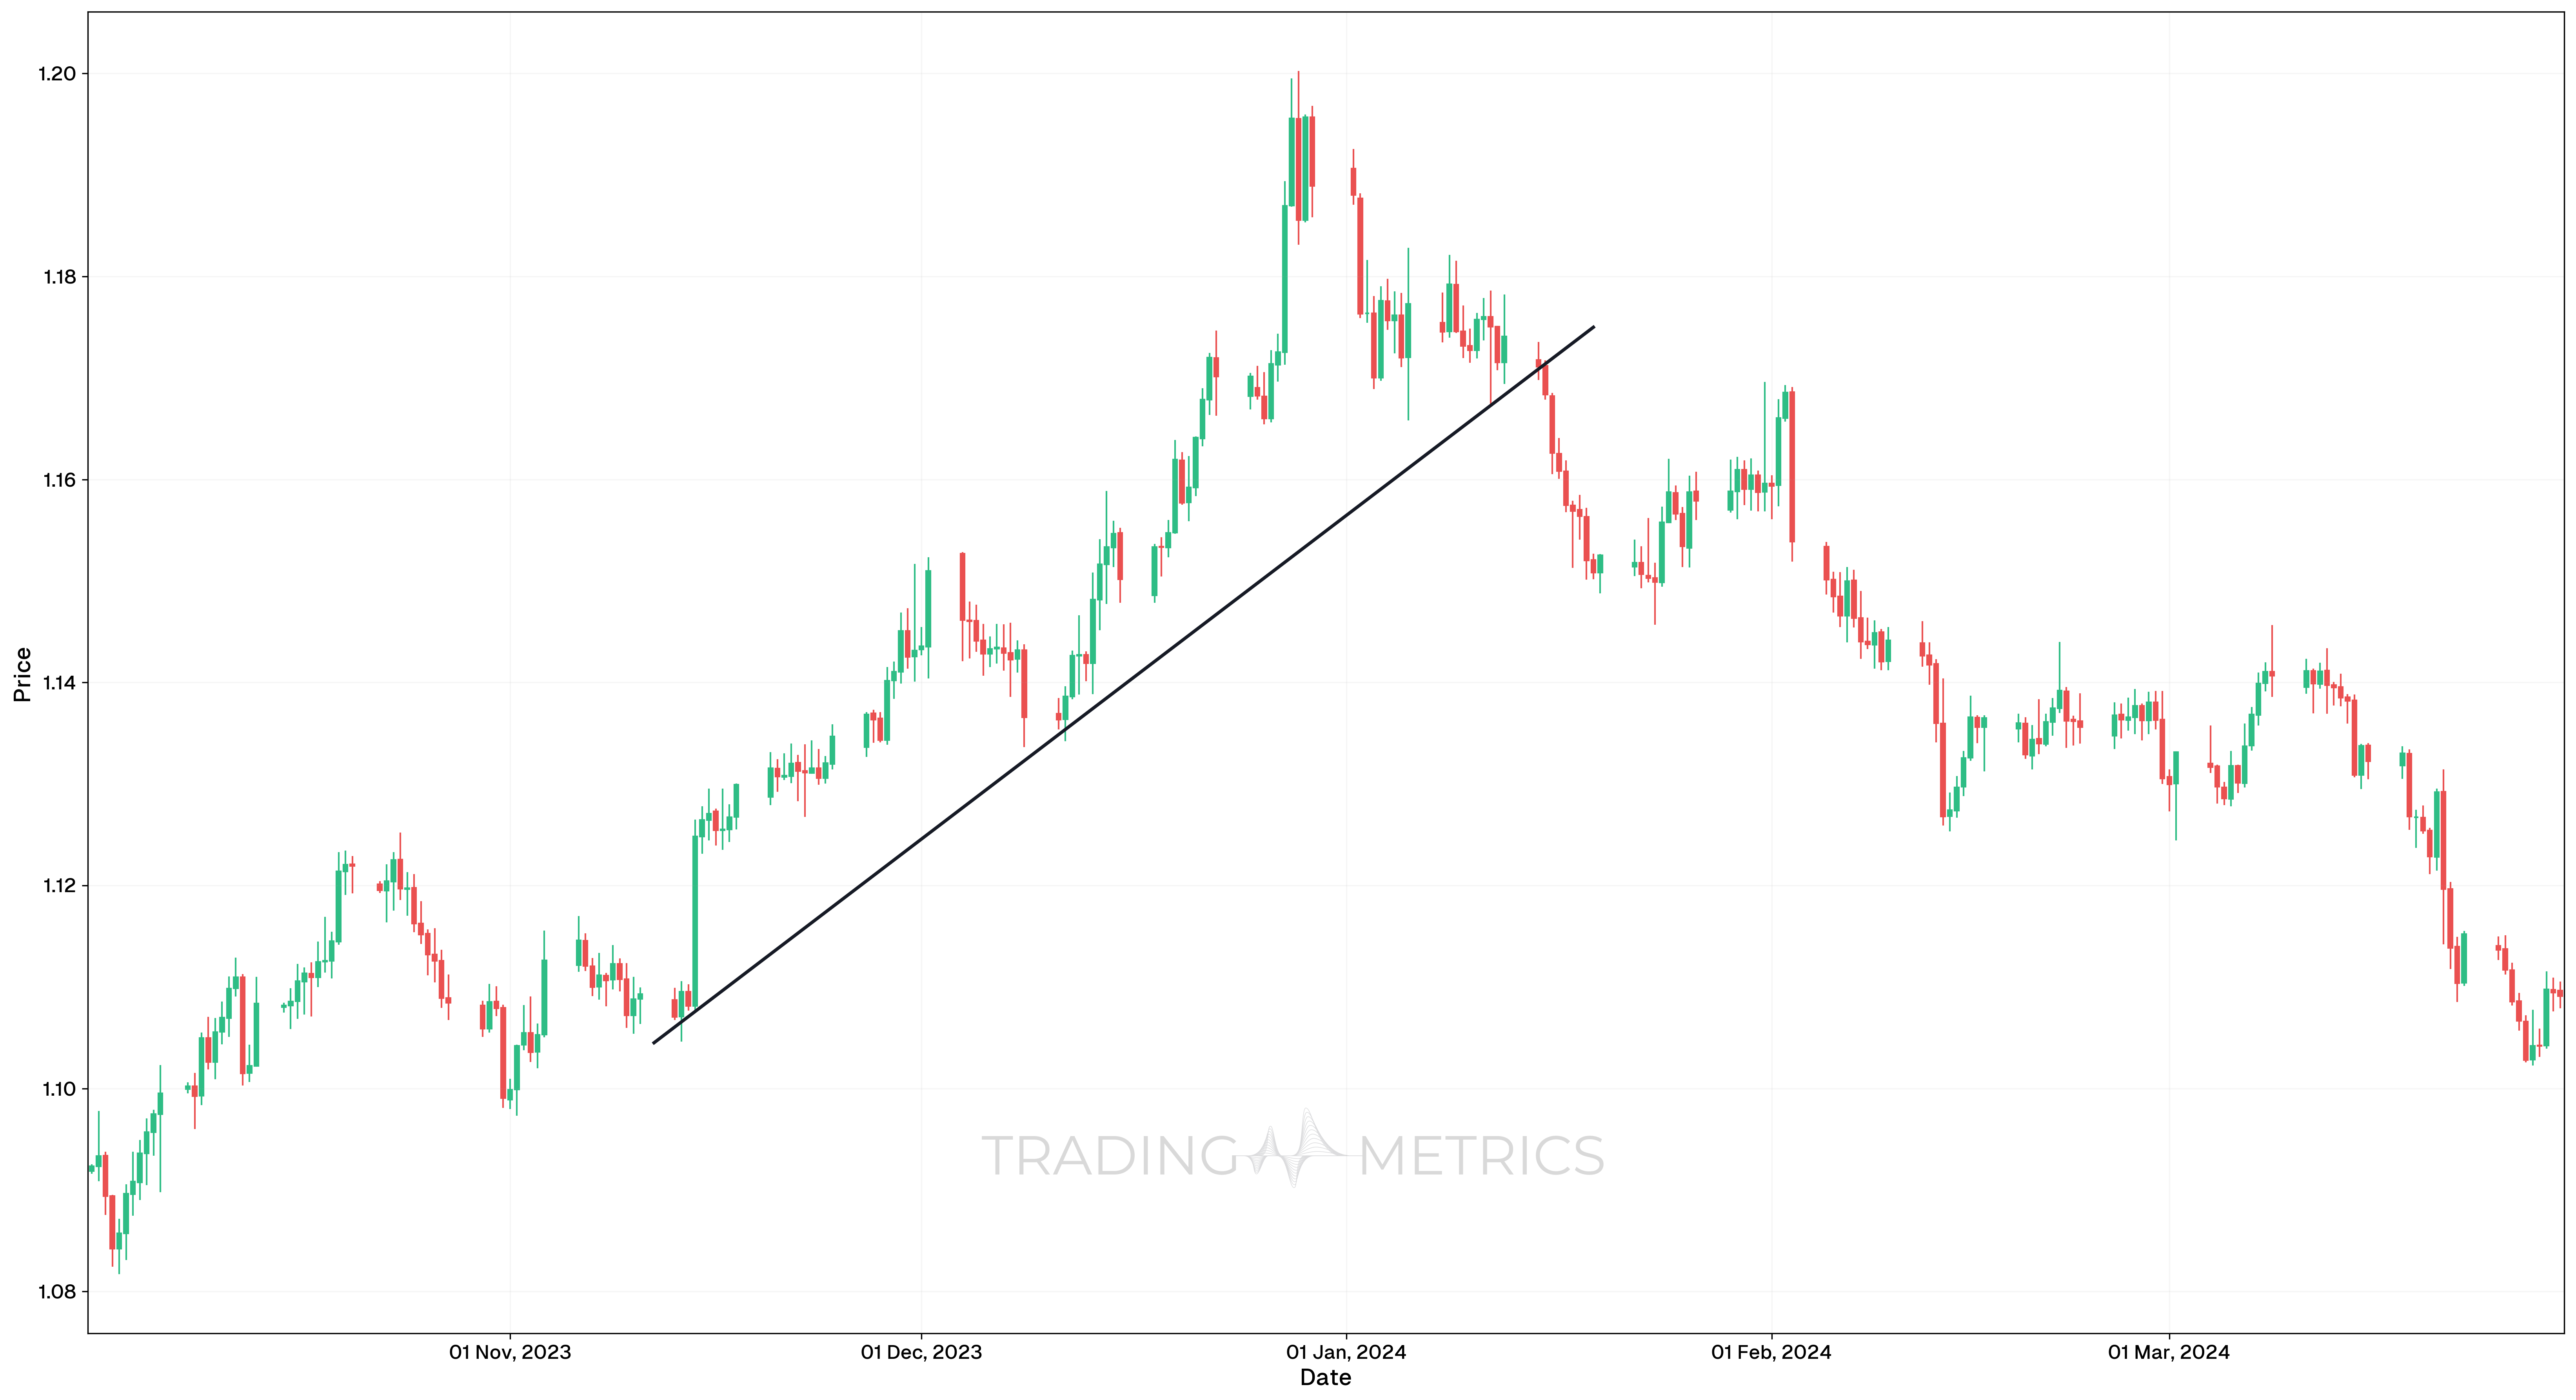
Steep Trend Line
A steep trend line rises or falls sharply, indicating strong momentum in either direction. The sharper the angle, the stronger and faster the trend, but steep trend lines are also more prone to breaking.
- How to Draw: Connect points of rapid price movement, resulting in a sharply sloped line.
- What It Indicates: There is strong momentum in the market. However, steep trend lines often break quickly, leading to a sharp reversal or pullback.
Shallow Trend Line
A shallow trend line has a gentle slope, indicating a slower or more gradual price trend. While these lines suggest less aggressive movement, they tend to last longer, making them more reliable in the long term.
- How to Draw: Connect points of gradual price increases or decreases.
- What It Indicates: The market is trending but at a slower pace, often resulting in a more stable price movement.
Internal Trend Line
An internal trend line cuts through price action instead of following the highs or lows perfectly. It’s often drawn to capture the general trend while passing through some price extremes.
- How to Draw: Draw a line that may cut through some candlestick wicks or bodies to capture the overall price direction.
- What It Indicates: The overall direction of the market while ignoring temporary price extremes, such as sharp spikes or corrections.
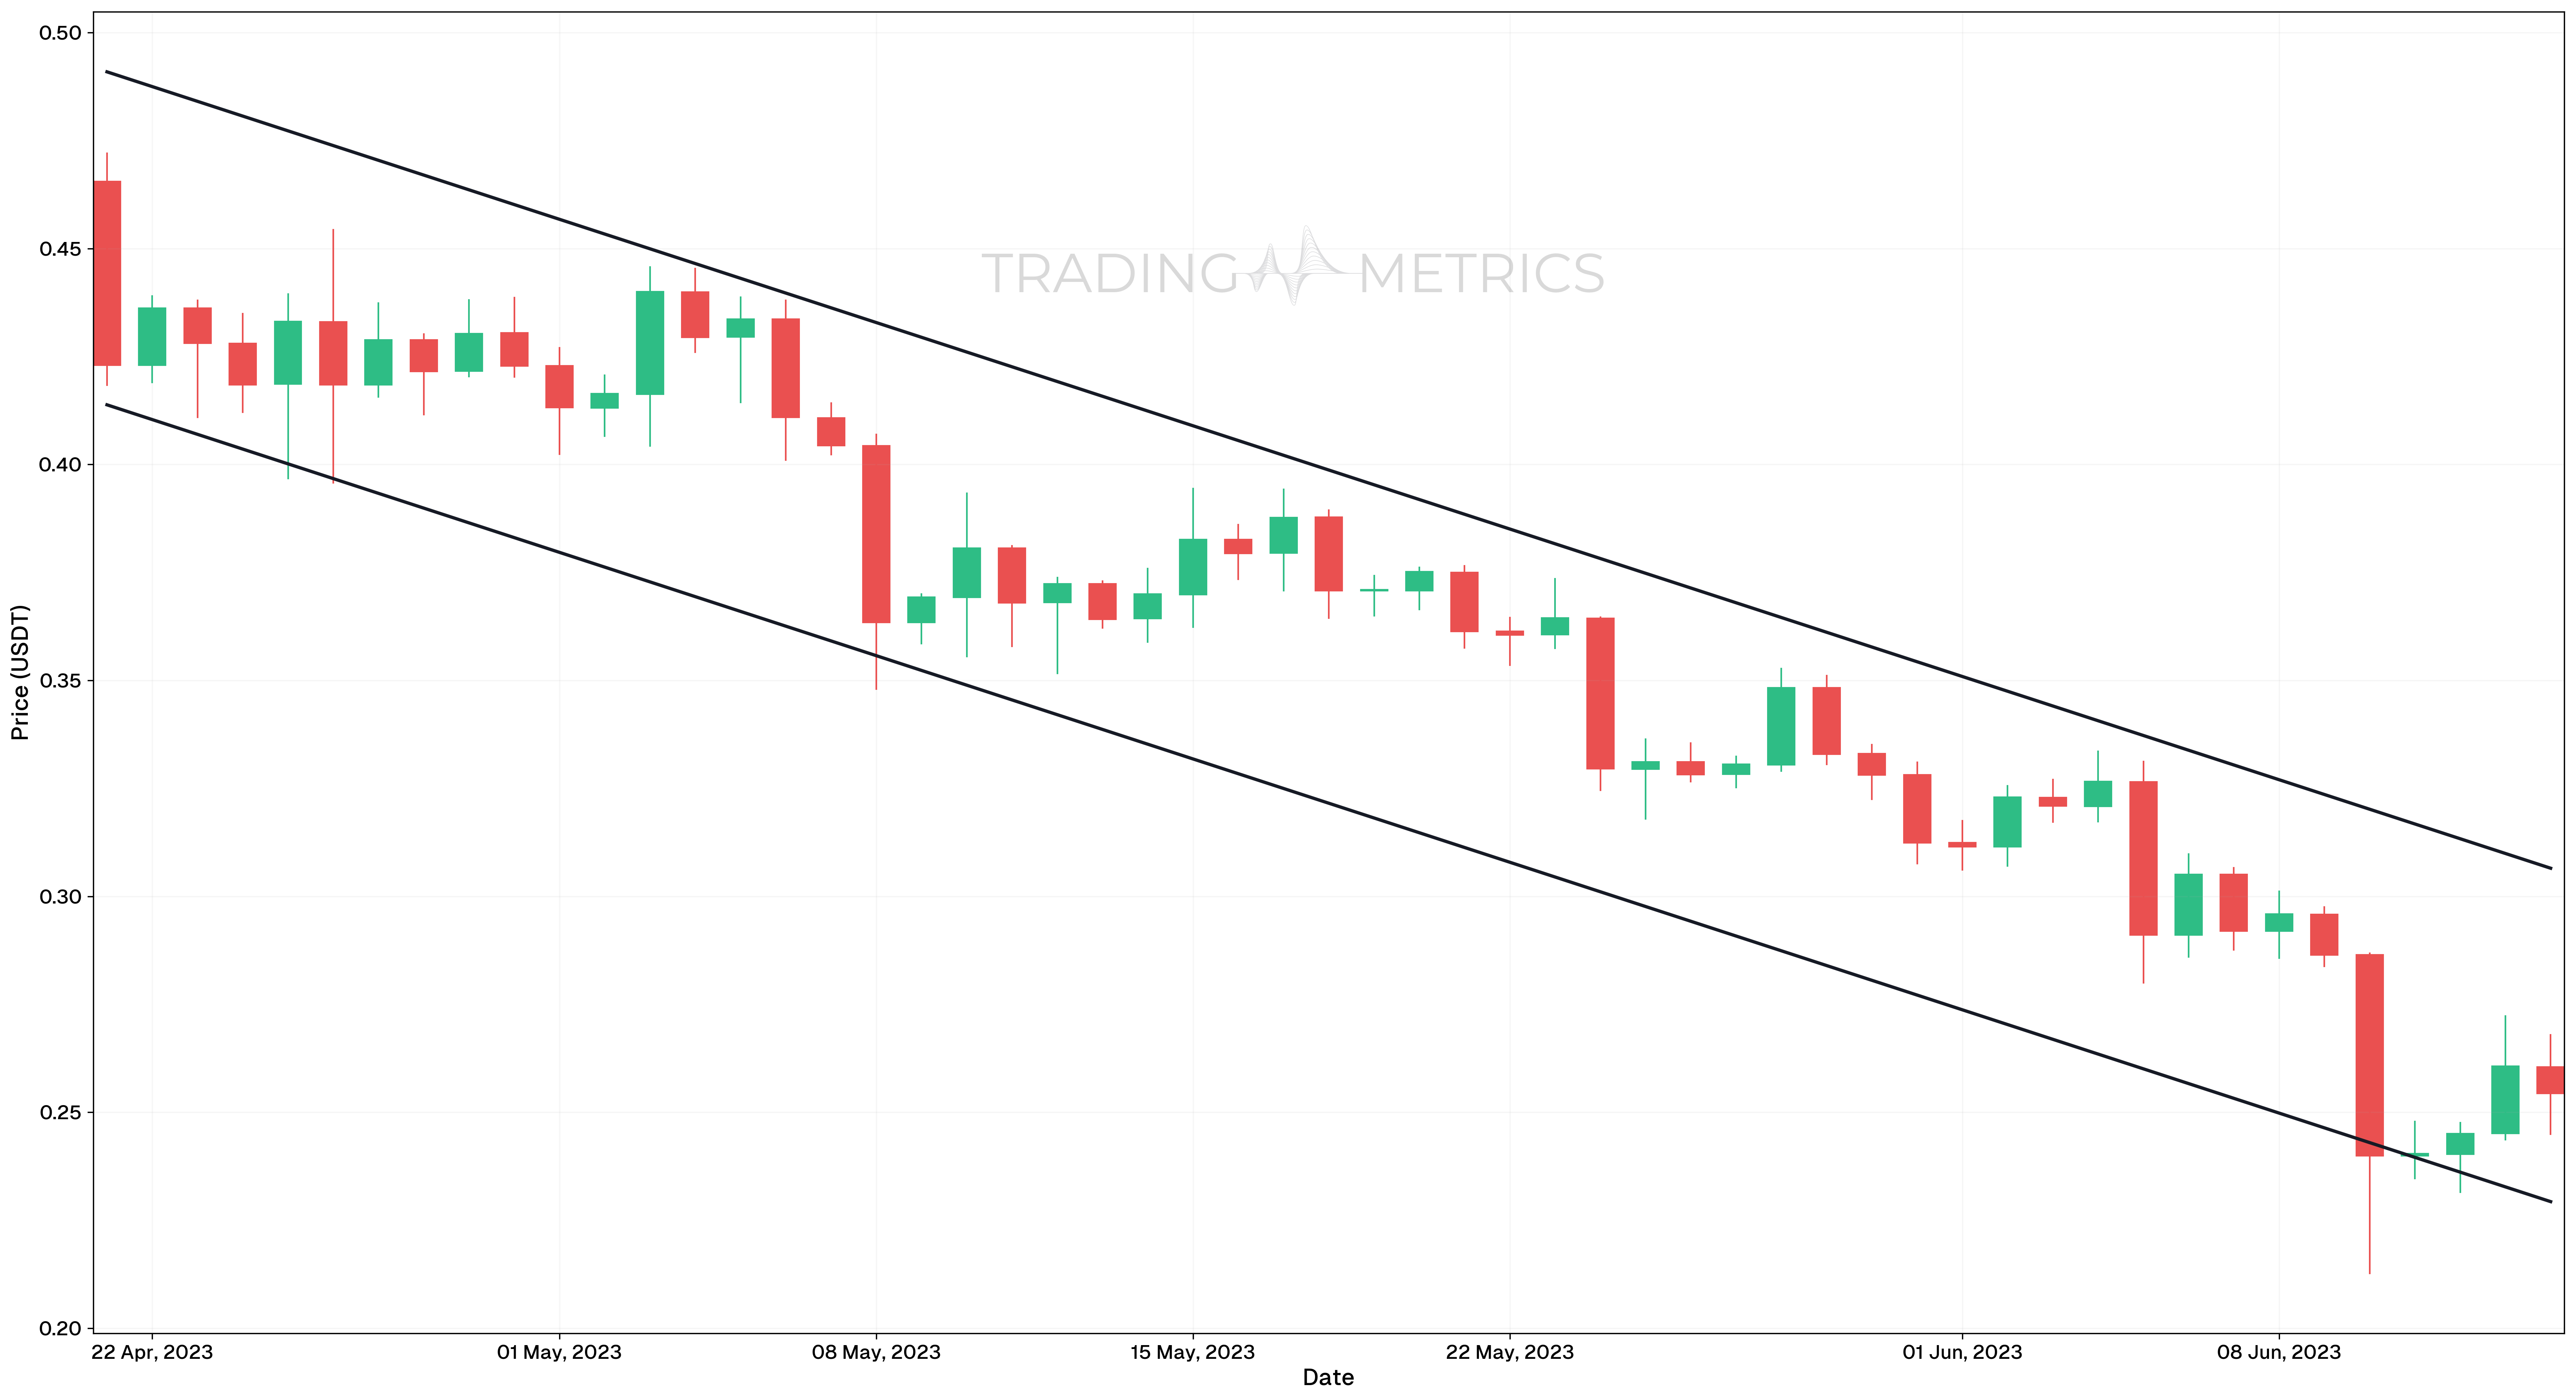
Channel Trend Line (Price Channel)
A channel trend line consists of two parallel lines: one that connects the highs (resistance) and another that connects the lows (support). This forms a channel that the price tends to move within.
- How to Draw: Draw one line connecting the highs and another line connecting the lows, ensuring both are parallel.
- What It Indicates: The market is trending within a defined range. The price will likely continue moving between the upper (resistance) and lower (support) trend lines until a breakout or breakdown occurs.
Summary of Trend Line Types
- Uptrend Line: Connects higher lows and indicates a bullish trend.
- Downtrend Line: Connects lower highs and indicates a bearish trend.
- Horizontal Trend Line: Marks support or resistance in a sideways market.
- Steep Trend Line: Indicates strong momentum but may break easily.
- Shallow Trend Line: Indicates gradual movement and tends to be more reliable.
- Internal Trend Line: Cuts through price action to show the general trend.
- Channel Trend Line: Two parallel lines indicating support and resistance within a range.
Each type of trend line offers unique insights into the market’s behavior, helping traders spot potential trading opportunities, breakouts, or reversals. By mastering these different kinds of trend lines, you can adapt your strategy to any market condition.
Avoid Forcing Lines: Draw trendlines that align with obvious price swings - forcing lines to fit can lead to unreliable signals.
Combining Trend Lines with Other Tools
While trend lines are powerful on their own, combining them with other technical indicators can enhance your analysis:
- Moving Averages: Overlaying a moving average with a trend line can help confirm a trend. If both the trend line and the 50-day moving average align and act as support, it provides stronger confirmation for a potential trade.
- Fibonacci Retracement: Trend lines and Fibonacci levels can work together to pinpoint precise entry points. For instance, if the price pulls back to a trend line that coincides with a 61.8% Fibonacci Retracement level, it’s a high-probability buying zone.
- Volume: Volume is key in confirming the strength of a trend. If price breaks a trend line with high volume, the breakout is more likely to be legitimate, indicating a potential trend reversal or acceleration.
Key Points
- Visual Representation of Trends: Trendlines are straight lines drawn on a chart to connect significant price points, helping identify the direction and strength of a trend.
- Support and Resistance: Uptrend lines act as support, while downtrend lines serve as resistance, providing key levels for trade entries and exits.
- Dynamic Nature: Trendlines adapt as price movements evolve, making them a flexible tool for tracking market behavior.
- Validation with Touch Points: A valid trendline typically requires at least two or three touch points to confirm its significance.
- Breakout Signals: A price break above a downtrend line or below an uptrend line often signals a potential trend reversal or acceleration.
- Use with Other Tools: Combine trendlines with indicators like RSI or MACD to confirm signals and reduce false breakouts.
- Customization Across Time Frames: Trendlines can be applied to any time frame, from intraday charts for scalping to weekly charts for long-term analysis.
- Adjust for Market Volatility: In volatile markets, consider redrawing trendlines to accommodate significant price spikes or drops.
- Channel Formation: Parallel trendlines can create price channels, highlighting potential trading ranges and breakout opportunities.
- Backtesting and Practice: Include trendline analysis in backtesting to improve accuracy and gain confidence in their application for live trading.
Conclusion
Mastering trendlines is essential for any trader looking to understand market dynamics and improve their technical analysis skills. They simplify the process of identifying trends, helping traders make more informed decisions about entry and exit points. By combining trendlines with other tools and indicators, traders can enhance their ability to anticipate market movements and manage risk effectively.
Frequently Asked Questions
Quick answers based on this page's topic.
A valid trendline requires at least two connecting price points, but it is only considered 'confirmed' once it has been touched three times. The more times a trendline successfully repels price without breaking, the stronger and more significant that support or decline becomes for future trades.
A true breakout is usually accompanied by a significant increase in volume and a candle close well beyond the line. Many professional traders wait for a 'retest'—where price returns to touch the broken trendline before continuing—to confirm that the previous support has turned into resistance.
While there is no single rule, consistency is key. Drawing through candle wicks captures the absolute extremes of market sentiment and volatility, whereas drawing through candle bodies focuses on where the majority of trading volume occurred. Most traders find wick-to-wick connections provide more precise reaction zones.