Dark Cloud Cover Pattern: How a Strong Open Becomes a Reversal
The Dark Cloud Cover pattern is a ominous bearish reversal signal in technical analysis, often looming at the top of an uptrend. Picture it as a storm rolling in - a bullish candle followed by a bearish one that opens higher but closes deep into the first candle’s body - casting doubt on the rally. When this pattern forms, it’s a shadowy hint that bullish momentum is fading, offering traders a chance to sell or short the asset as a downtrend threatens to descend.
How to Identify the Dark Cloud Cover Pattern in Trading
The Dark Cloud Cover is a bearish reversal candlestick formation. It develops over two candles at the peak of an uptrend, with the second candle opening higher but closing deep into the prior candle’s body. The setup signals a sharp shift from buyers to sellers. Here’s how to spot it:
Start with the Big Picture
This pattern forms during an uptrend. Buyers extend the rally on the first candle, but the second candle sharply reverses sentiment, signaling seller dominance.
Trace the Two-Candle Sequence
The structure unfolds in two stages. Spotting how the second candle penetrates the first confirms the setup.
- First Candle: A strong bullish candle extending the uptrend.
- Second Candle: A bearish candle that opens above the first candle’s high (or close) and closes below the midpoint of its body, covering at least 50% of its range.
Zero in on the Confirmation Level
The confirmation level is the midpoint of the first candle’s body. The bearish candle must close below this level to validate the pattern.
Watch the Breakdown
The bearish trigger comes when the second candle closes below the midpoint of the first candle’s body.
- A decisive close beneath 50% retracement or
- A large bearish body
Both confirm the reversal and provide the entry.
Check Volume for Additional Confirmation
Volume activity strengthens the signal.
- Rises on the first bullish candle as buyers push higher.
- Spikes or holds firm on the bearish candle, confirming seller control.
Cast the Drop: Measure the height of the first candle or use nearby support levels to project a realistic price target downward from the second candle’s close.
How to Trade the Dark Cloud Cover Pattern (Trading Example)
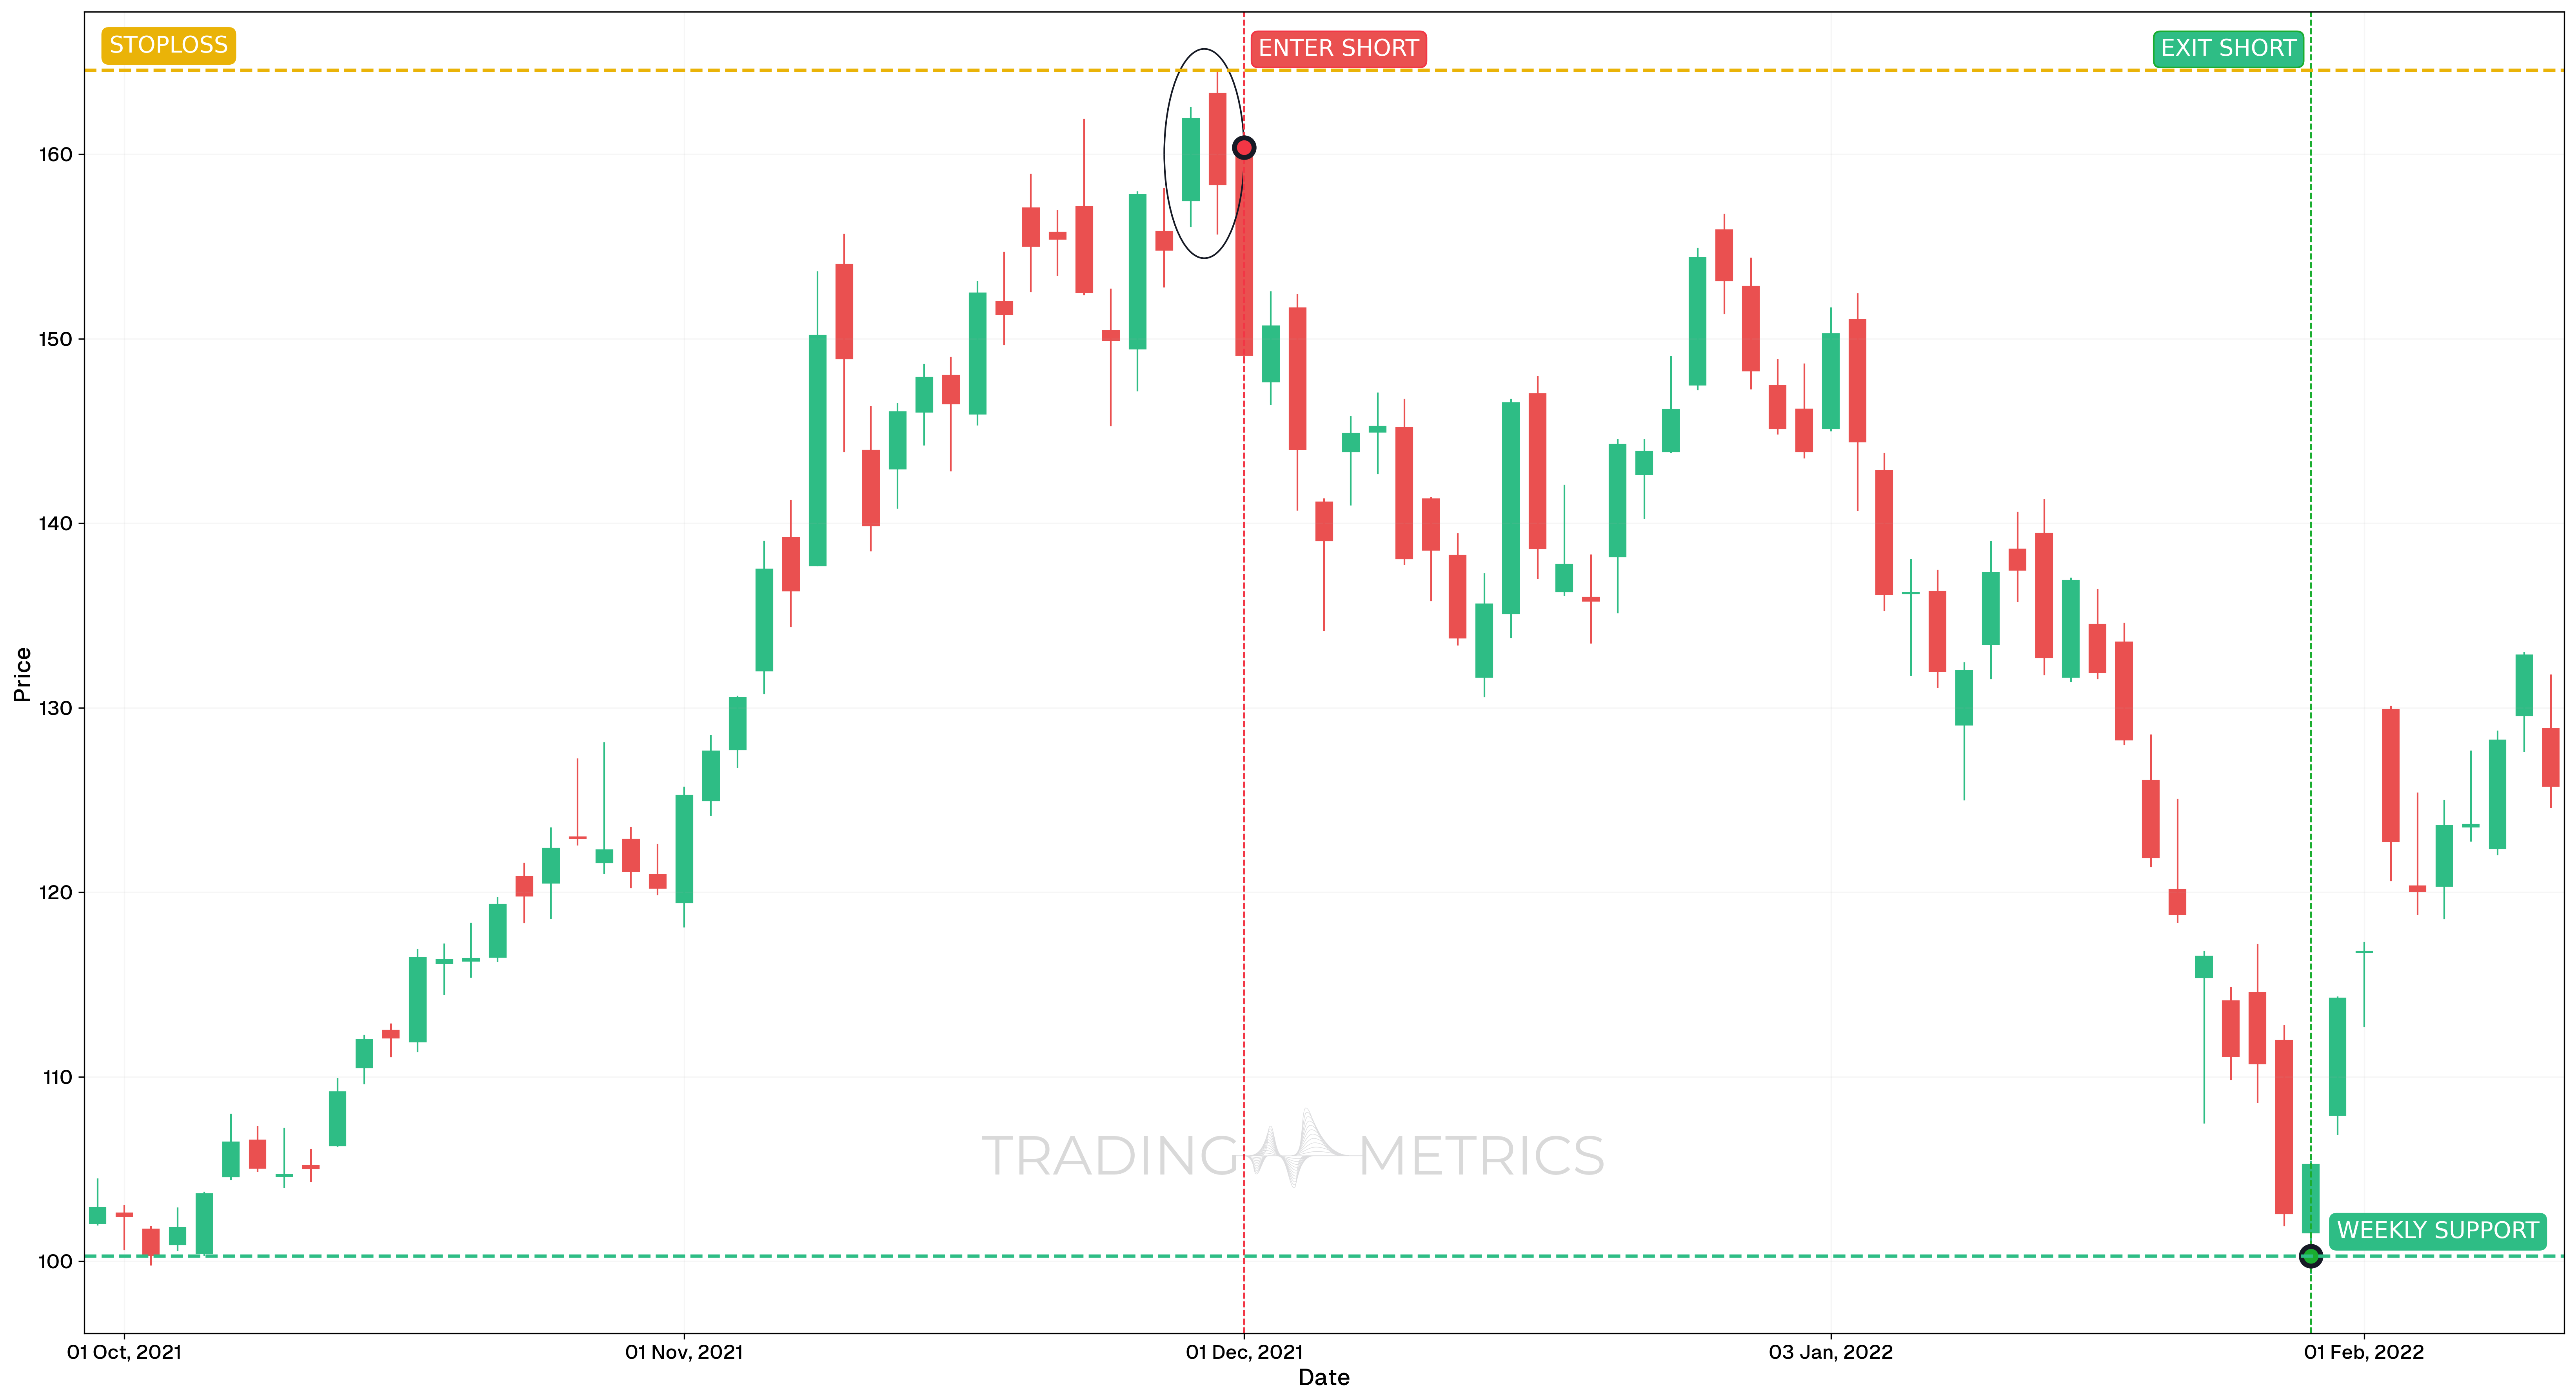
To illustrate how the Dark Cloud Cover pattern can be used to enter a trade, we will examine the AMD stock on the daily chart. This bearish candlestick formation provided a clear reversal signal after a strong uptrend, offering an opportunity to short near the top of a major move.
Analysis
Between October 2021 and January 2022, AMD extended into an overheated rally. On December 1, 2021, a clear Dark Cloud Cover pattern formed, where the second candle opened above the prior close and then closed deep into the previous bullish candle’s body. This signaled strong bearish rejection and a likely reversal.
Trade Setup
-
Entry: The trade was entered on December 1, 2021, at $160.37, immediately after the Dark Cloud Cover pattern completed. Entry confirmation included:
- RSI falling below 50, indicating a loss of bullish momentum
- Strong pattern symmetry following an extended uptrend
-
Exit: The trade was exited on January 28, 2022, at $100.29, near a prior support/resistance zone that had acted as structural demand earlier in the move.
-
Outcome: This trade delivered a sharp reversal with over 37.5% downside, capturing a major leg of profit during AMD’s trend correction.
Risk Management
- Stop-Loss placement: The stop-loss was set at $164.55, just above the wick of the pattern’s second candle. This protected the short entry while giving the trade sufficient room to validate the setup.
- Position sizing: A standard 2% capital risk model was used, adjusting size based on the entry-to-stop distance.
- Volatility Consideration: This reversal formed as volatility was peaking. Taking the trade on confirmation helped avoid premature entries during emotional price expansion.
- Risk-Reward Ratio: The trade achieved a remarkable Risk-Reward Ratio of 1:14.37, which is exceptionally favorable for a single-leg bearish swing.
- Adaptive Exit Strategy: Though multiple target levels could have been used, this example demonstrates a clean, full-exit strategy based on prior support levels.
Volume Shadow: A volume spike on the bearish candle casts the pattern into a dark reversal.
Pre-Trade Checklist
Cloud the Proof: Pair the pattern with volume spikes and indicators like RSI to dodge fakes and darken your odds.
Key Points
- Candle Clash: A strong bullish candle followed by a deep bearish cover boosts reliability - shallow covers dilute it.
- Time Frame: Strikes hardest on daily or weekly charts after uptrends.
- Combine with Indicators: Use moving averages or RSI to confirm the reversal.
- Breakout Confirmation: The second candle’s close below the first’s midpoint sets the turn - don’t jump too soon.
- Price Target: Measure the first candle height or use support levels for a target below the close.
- Risk Management: Set a stop-loss above the second candle’s high to limit losses if it fails.
Wait for the Cloud: Acting before the second candle closes risks a fleeting shadow - let it cover.
Conclusion
The Dark Cloud Cover pattern is a trader’s shadowy tool for catching bearish reversals. Its two-candle clash, paired with volume, RSI, and moving averages, can cast big gains. Whether in crypto, stocks, or forex, this pattern sharpens your edge. Stay vigilant, manage your risk, and let the cloud form - that dark cover could sink into a winning trade.
Frequently Asked Questions
Quick answers based on this page's topic.
For the Dark Cloud Cover to be valid, the second (bearish) candle must gap up above the previous close but then reverse to close below the 50% midpoint of the first candle's body. This deep penetration proves that sellers have successfully rejected the attempt at higher prices.
The initial gap up shows that buyers were still aggressive, but the subsequent move back into the previous day's range indicates that those buyers were trapped. The failure to hold the gap-up levels creates a psychological 'trap' that often fuels a rapid sell-off.
While slightly less aggressive than a Bearish Engulfing (which swallows the entire candle), Dark Cloud Cover is still a very strong reversal signal. It is often preferred by swing traders because the 'rejection of the gap' provides a very clear level for risk management.