Elliott Wave Theory: Decoding Market Cycle Phases
Elliott Wave Theory is a method of technical analysis based on the idea that market prices move in repeating patterns driven by investor psychology. The classic approach, developed by Ralph Nelson Elliott in the 1930s, identifies a five-wave trend followed by a three-wave correction. In modern usage, traders often adapt the theory with Fibonacci ratios, wave extensions, and real-time pattern adjustments to better fit today’s fast-moving markets. Despite its subjective nature, the framework remains popular for forecasting market direction and timing entries.
How to Use Elliott Wave Theory?
Elliott Wave Theory divides price movements into two main categories: impulse waves and corrective waves. Understanding the difference is essential for identifying trend direction and spotting high-probability trade setups.
Impulse Waves
Impulse waves move in the direction of the overall trend and consist of five distinct waves: three motive waves (1, 3, 5) and two corrective waves (2 and 4). These waves typically form in bullish or bearish trends and follow strict rules related to structure and wave relationships.
- Wave 1: The initial move with low participation.
- Wave 2: A correction that never retraces more than 100% of wave 1.
- Wave 3: The strongest and longest wave, never the shortest.
- Wave 4: A shallow correction that avoids entering wave 1’s territory.
- Wave 5: The final push, often driven by momentum traders.
Corrective Waves
Corrective waves move against the direction of the trend and typically form a three-wave structure labeled A-B-C. These waves occur after a five-wave impulse and are usually more complex and less predictable than impulse waves.
- Wave A: The first move against the trend.
- Wave B: A partial retracement that tricks traders into thinking the trend continues.
- Wave C: A final move completing the correction.
Corrective patterns can vary in complexity, forming simple zigzags, flats, or complex combinations. Identifying these structures helps traders anticipate potential trend continuation or reversal zones.
- Wave 2 never retraces 100% of Wave 1: It can be deep, but it must not break the origin of Wave 1.
- Wave 3 is never the shortest: Among Waves 1, 3, and 5, Wave 3 must not be the smallest in length.
- Wave 4 never enters Wave 1 territory: In an impulse, Wave 4 must stay above the peak of Wave 1 (in uptrends) or below it (in downtrends).
These rules are taken from Ralph Nelson Elliott’s original writings, particularly “The Wave Principle” (1938) and later expanded in “Nature’s Law – The Secret of the Universe” (1946). They are part of the core structure that defines a valid Elliott impulse wave.
Understanding the Relationship Between Fibonacci and Elliott Wave Theory
Fibonacci ratios play a major role in modern applications of Elliott Wave Theory. While Elliott initially focused on wave patterns and psychology, later analysts discovered that Fibonacci numbers appear repeatedly in the length and timing of waves - making the two tools highly complementary.
Traders combine Fibonacci and Elliott Wave Theory to:
- Measure Wave Targets: Fibonacci extensions and retracements help project where impulse or corrective waves are likely to complete. For example, Wave 3 often extends to 161.8% the length of Wave 1, while Wave 2 typically retraces 50% to 61.8% of Wave 1.
- Confirm Wave Validity: If wave lengths or retracements fall outside typical Fibonacci zones, traders may question the count or look for alternate structures.
- Spot Entry and Exit Zones: Using Fibonacci Retracement levels within an Elliott structure helps define high-probability entry points and logical stop-loss placements, especially during Waves 2 and 4.
- Align Time and Price Projections: Some advanced traders also apply Fibonacci time extensions to forecast when a wave might complete, not just where.
Common Uses in Practice
- Wave 2: Retraces 61.8% or less of Wave 1 (deep but not full reversal).
- Wave 3: Often extends to 161.8% or 261.8% the length of Wave 1 - considered the strongest wave.
- Wave 4: Frequently retraces 23.6% to 38.2% of Wave 3.
- Wave 5: Can be equal to Wave 1 (100%) or form a Fibonacci extension from Waves 0 to 3.
Why It Matters?
Mixing Fibonacci with Elliott Wave Theory allows for a more structured and rule-based approach to what is otherwise a subjective pattern system. It helps reduce guesswork, improves precision in targeting, and increases confidence in trade timing - especially when multiple Fibonacci levels cluster near wave completion points.
Notation System
Elliott Wave Theory uses a structured notation system to clearly label and distinguish between waves of different degrees. This is essential for keeping track of complex wave structures, especially when analyzing multi-timeframe charts or nested patterns.
Standard Notation by Wave Degree
Each level of wave structure (called a degree) has its own notation style:
| Level | Notation Style |
|---|---|
Grand Super Cycle | ((I)) ((II)) ((III)) ((IV)) ((V)) ((a)) ((b)) ((c)) ((w)) ((x)) ((y)) |
Super Cycle | (I) (II) (III) (IV) (V) (a) (b) (c) (w) (x) (y) |
Cycle | I II III IV V a b c w x y |
Primary | ((1)) ((2)) ((3)) ((4)) ((5)) ((A)) ((B)) ((C)) ((W)) ((X)) ((Y)) |
Intermediate | (1) (2) (3) (4) (5) (A) (B) (C) (W) (X) (Y) |
Minor | 1 2 3 4 5 A B C W X Y |
Minute | ((i)) ((ii)) ((iii)) ((iv)) ((v)) ((a)) ((b)) ((c)) ((w)) ((x)) ((y)) |
Minuette | (i) (ii) (iii) (iv) (v) (a) (b) (c) (w) (x) (y) |
Subminuette | i ii iii iv v a b c w x y |
This hierarchical system ensures clarity when analyzing structures like a five-wave impulse forming part of a larger corrective pattern, or corrections within a longer-term trend.
Practical Use
Using proper notation allows traders to:
- Keep track of wave positions across multiple timeframes.
- Maintain consistency when labeling wave counts.
- Communicate complex ideas more clearly in analysis and trade setups.
Most modern Elliotticians also combine color-coding or use software tools to handle notation automatically, but understanding the manual system remains crucial for disciplined wave counting.
Main Corrective Wave Forms
Corrective waves follow impulse moves and typically unfold in three-wave structures labeled A-B-C. However, not all corrections look the same. Elliott Wave Theory defines several types of corrective patterns - each with unique characteristics in structure, depth, and behavior. Understanding the differences helps traders better identify real-time setups and avoid mislabeling.
Zigzag (5-3-5)
Context
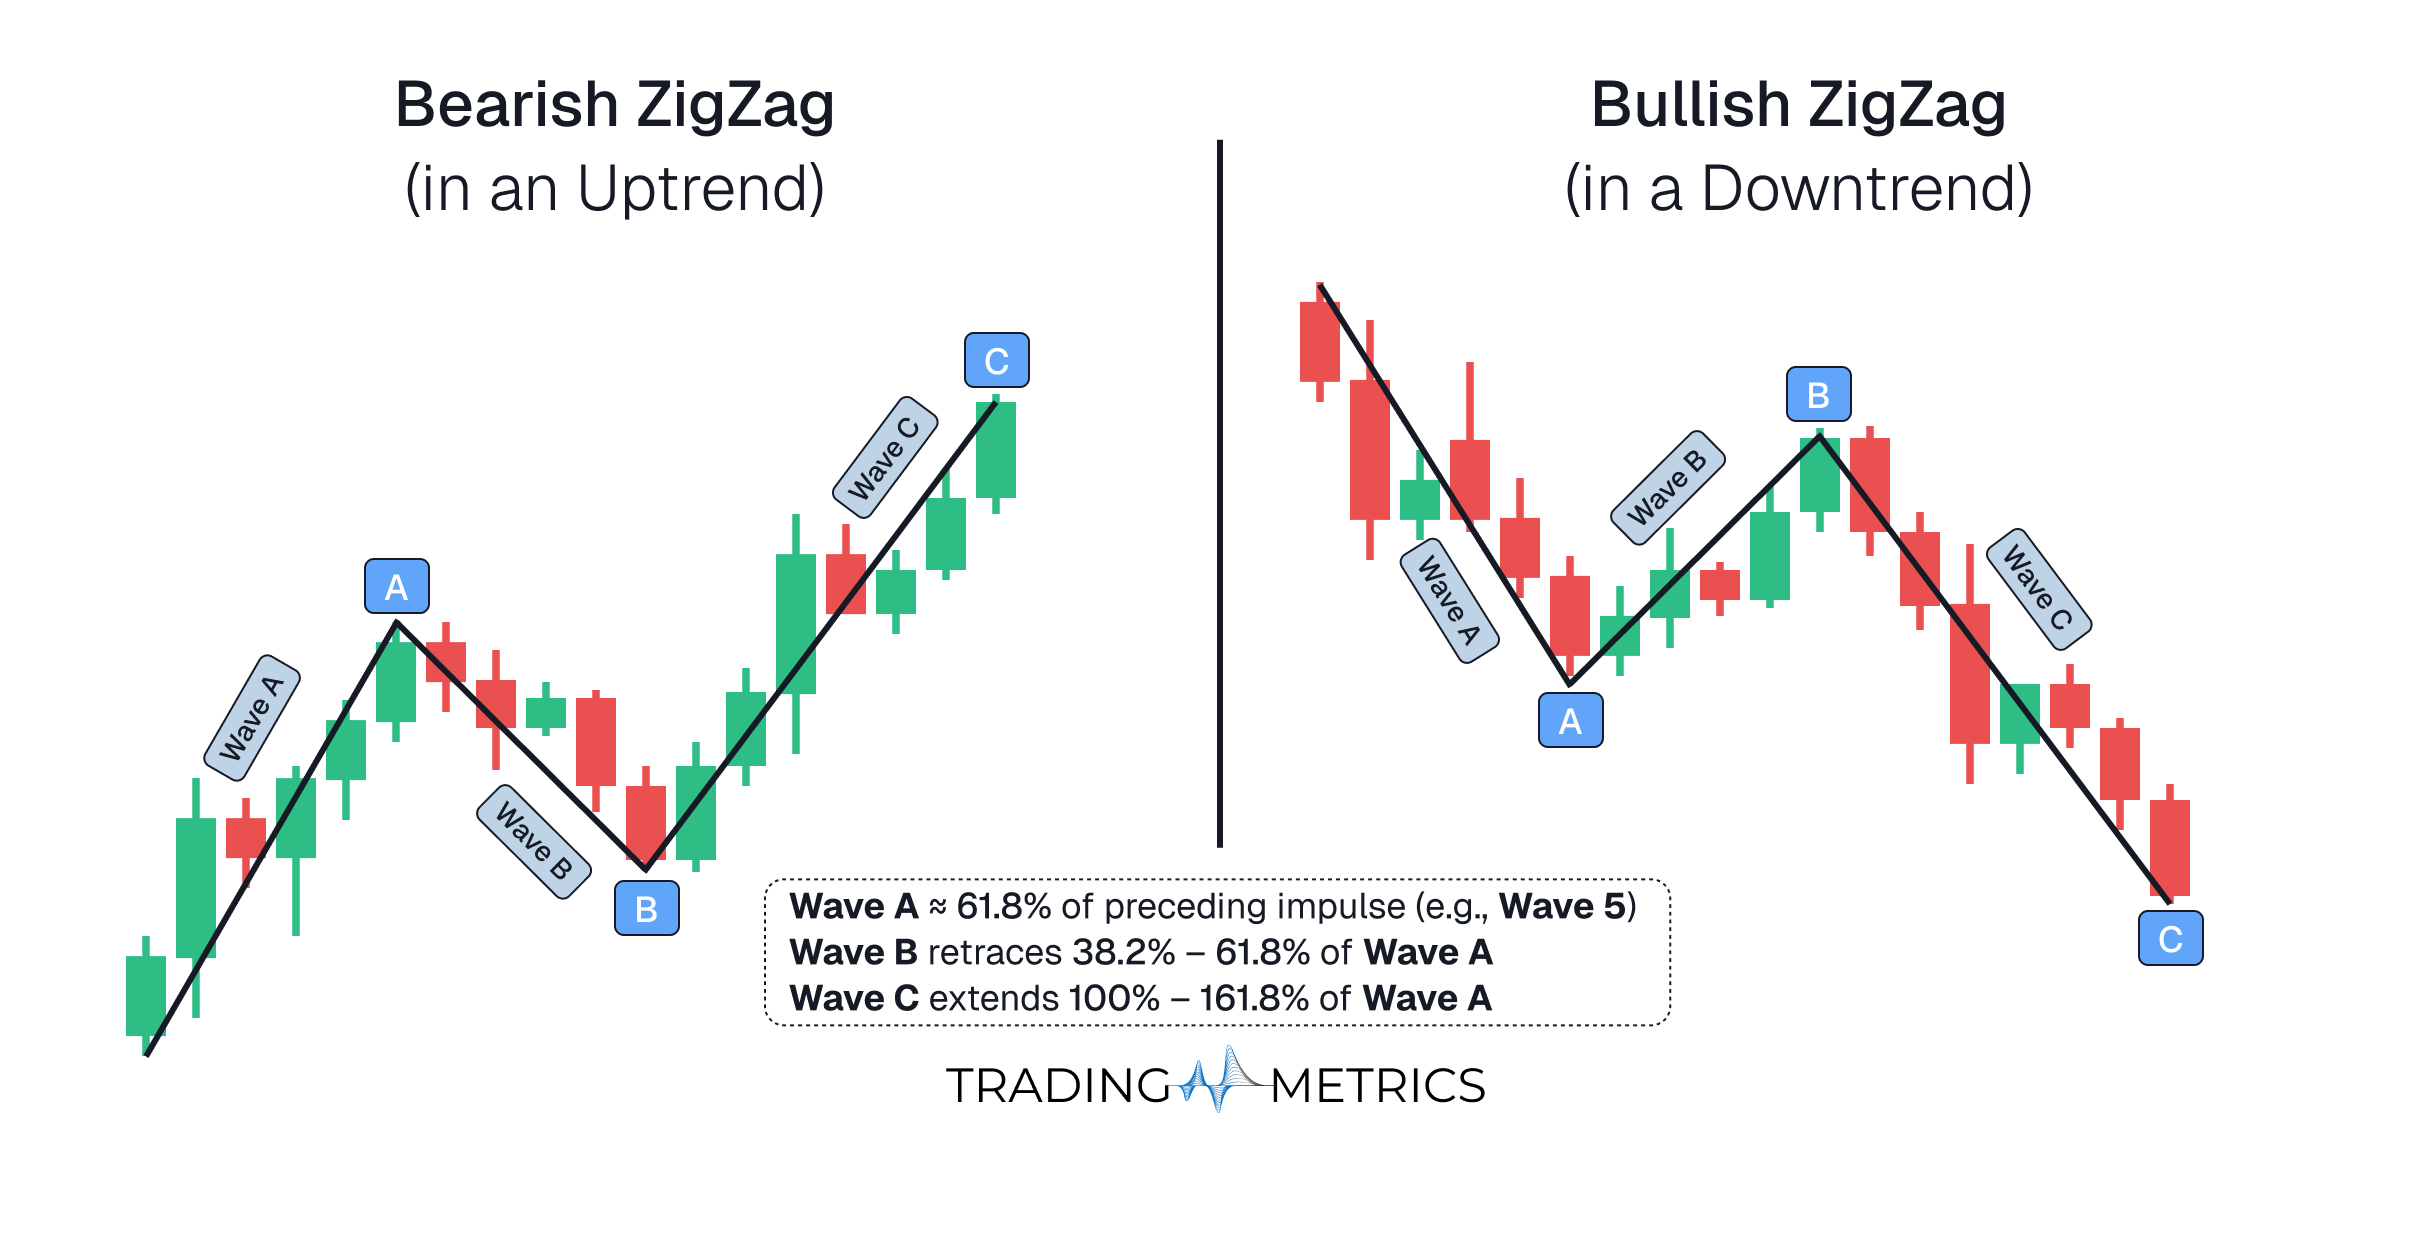
A Zigzag is a sharp, temporary counter-trend move that occurs within a larger trend. It commonly appears as a bullish rally in a downtrend or a bearish pullback in an uptrend. Once complete, the dominant trend typically resumes.
Structure
The Zigzag pattern follows a 5-3-5 wave sequence:
- Wave A: Moves against the main trend in 5 waves (impulsive or leading diagonal).
- Wave B: A 3-wave retracement in the direction of the main trend, usually retracing less than 61.8% of Wave A.
- Wave C: A final 5-wave move in the direction of Wave A, often extending beyond Wave A’s termination point.
Zigzags are distinguished by their clear 5-3-5 internal structure and sharper directional movement compared to flats or triangles.
Trading
The pattern presents a short-term opportunity to trade in the direction of Wave C, before the larger trend resumes.
-
In a bullish Zigzag (within a downtrend):
The trader may look to buy at the end of Wave B, targeting Wave C’s high, expecting the downtrend to continue afterward. -
In a bearish Zigzag (within an uptrend):
The trader may look to sell at the end of Wave B, targeting Wave C’s low, anticipating a continuation of the uptrend afterward.
Key Points
- Zigzags are sharp and temporary, not trend reversals.
- Always unfolds as 5-3-5, making it structurally easy to identify.
- Wave B is shallow, typically retracing 61.8% of Wave A.
- Wave C often exceeds Wave A, providing a strong follow-through.
- Seen in corrections, not in motive wave positions.
Flat (3-3-5)
Context
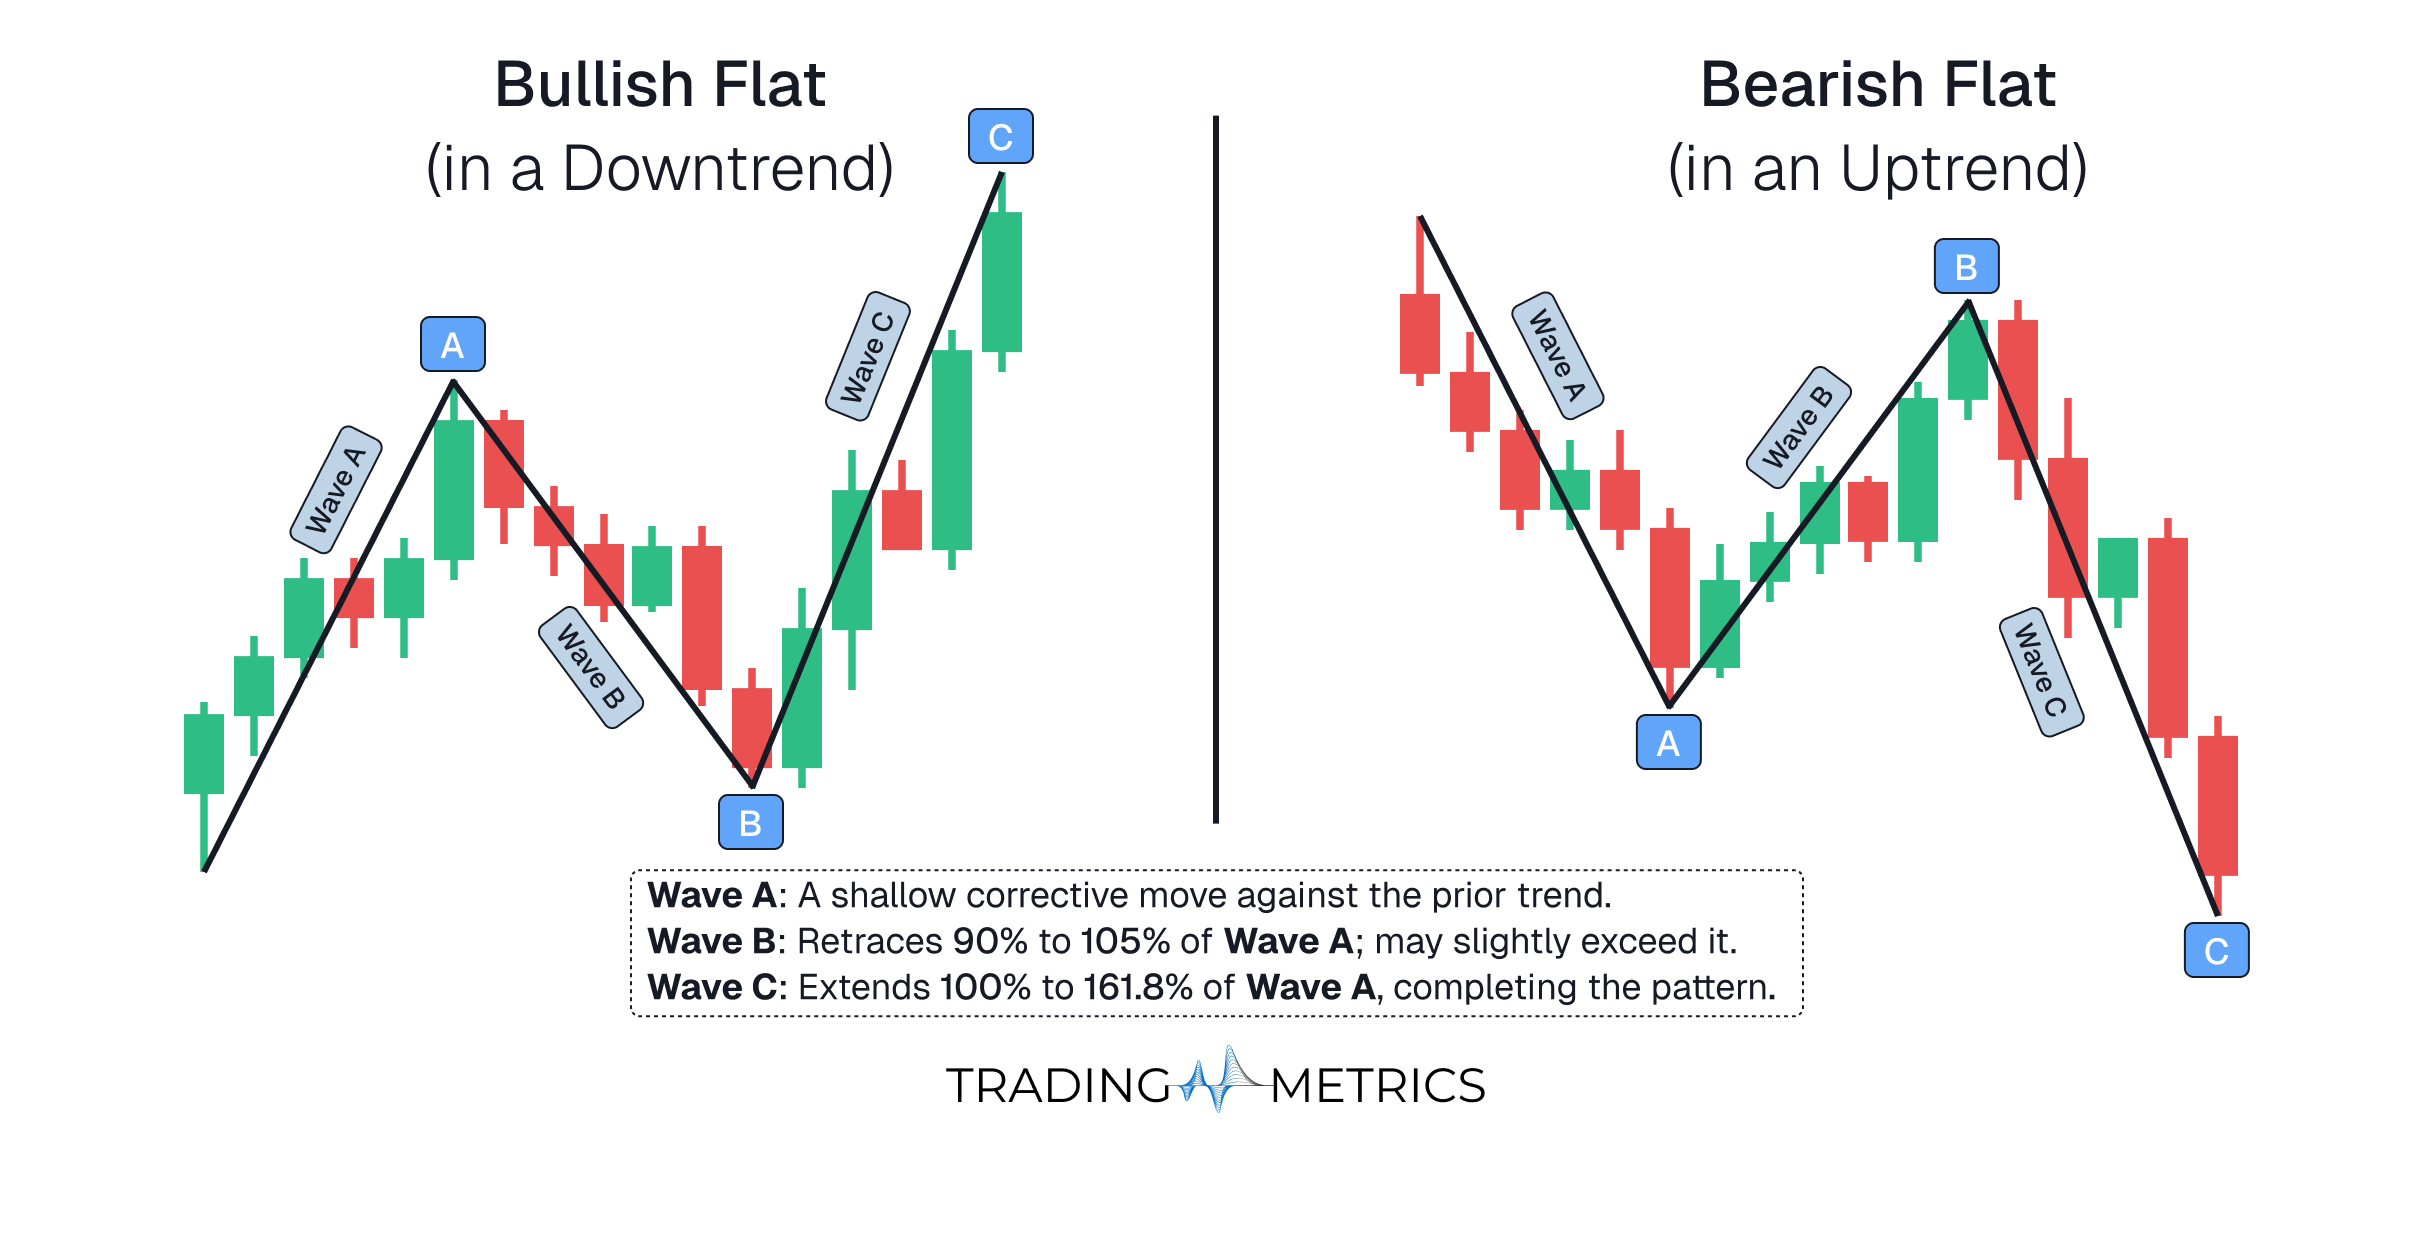
A Flat is a sideways, corrective pattern that occurs within a larger trend. It commonly appears as a bullish consolidation in a downtrend or a bearish pause in an uptrend. Once complete, the dominant trend typically resumes.
Structure
The Flat pattern follows a 3-3-5 wave sequence:
- Wave A: Moves against the main trend in 3 corrective waves (typically a zigzag).
- Wave B: A 3-wave retracement that usually reaches or exceeds 90–105% of Wave A.
- Wave C: A final 5-wave move in the direction of Wave A, but typically does not travel far beyond Wave A.
Flats are characterized by their 3-3-5 structure and sideways movement, with Wave B often retracing more than Wave A, making them less directional than zigzags.
Trading
The pattern offers a short-term opportunity to trade in the direction of Wave C, but price often does not move far from the start of the pattern.
-
In a bullish Flat (within a downtrend):
The trader may look to buy at the end of Wave B, targeting Wave C’s high, before the downtrend resumes. -
In a bearish Flat (within an uptrend):
The trader may look to sell at the end of Wave B, targeting Wave C’s low, before the uptrend continues.
Key Points
- Flats are sideways corrections, not aggressive retracements.
- Always unfolds as 3-3-5, making them distinct from zigzags (5-3-5).
- Wave B often retraces or exceeds 100% of Wave A, creating a false sense of trend continuation.
- Wave C forms 5 waves, but often lacks strong follow-through.
- Frequently seen in wave 4s and B waves of complex corrections.
Triangle (3-3-3-3-3)
Context
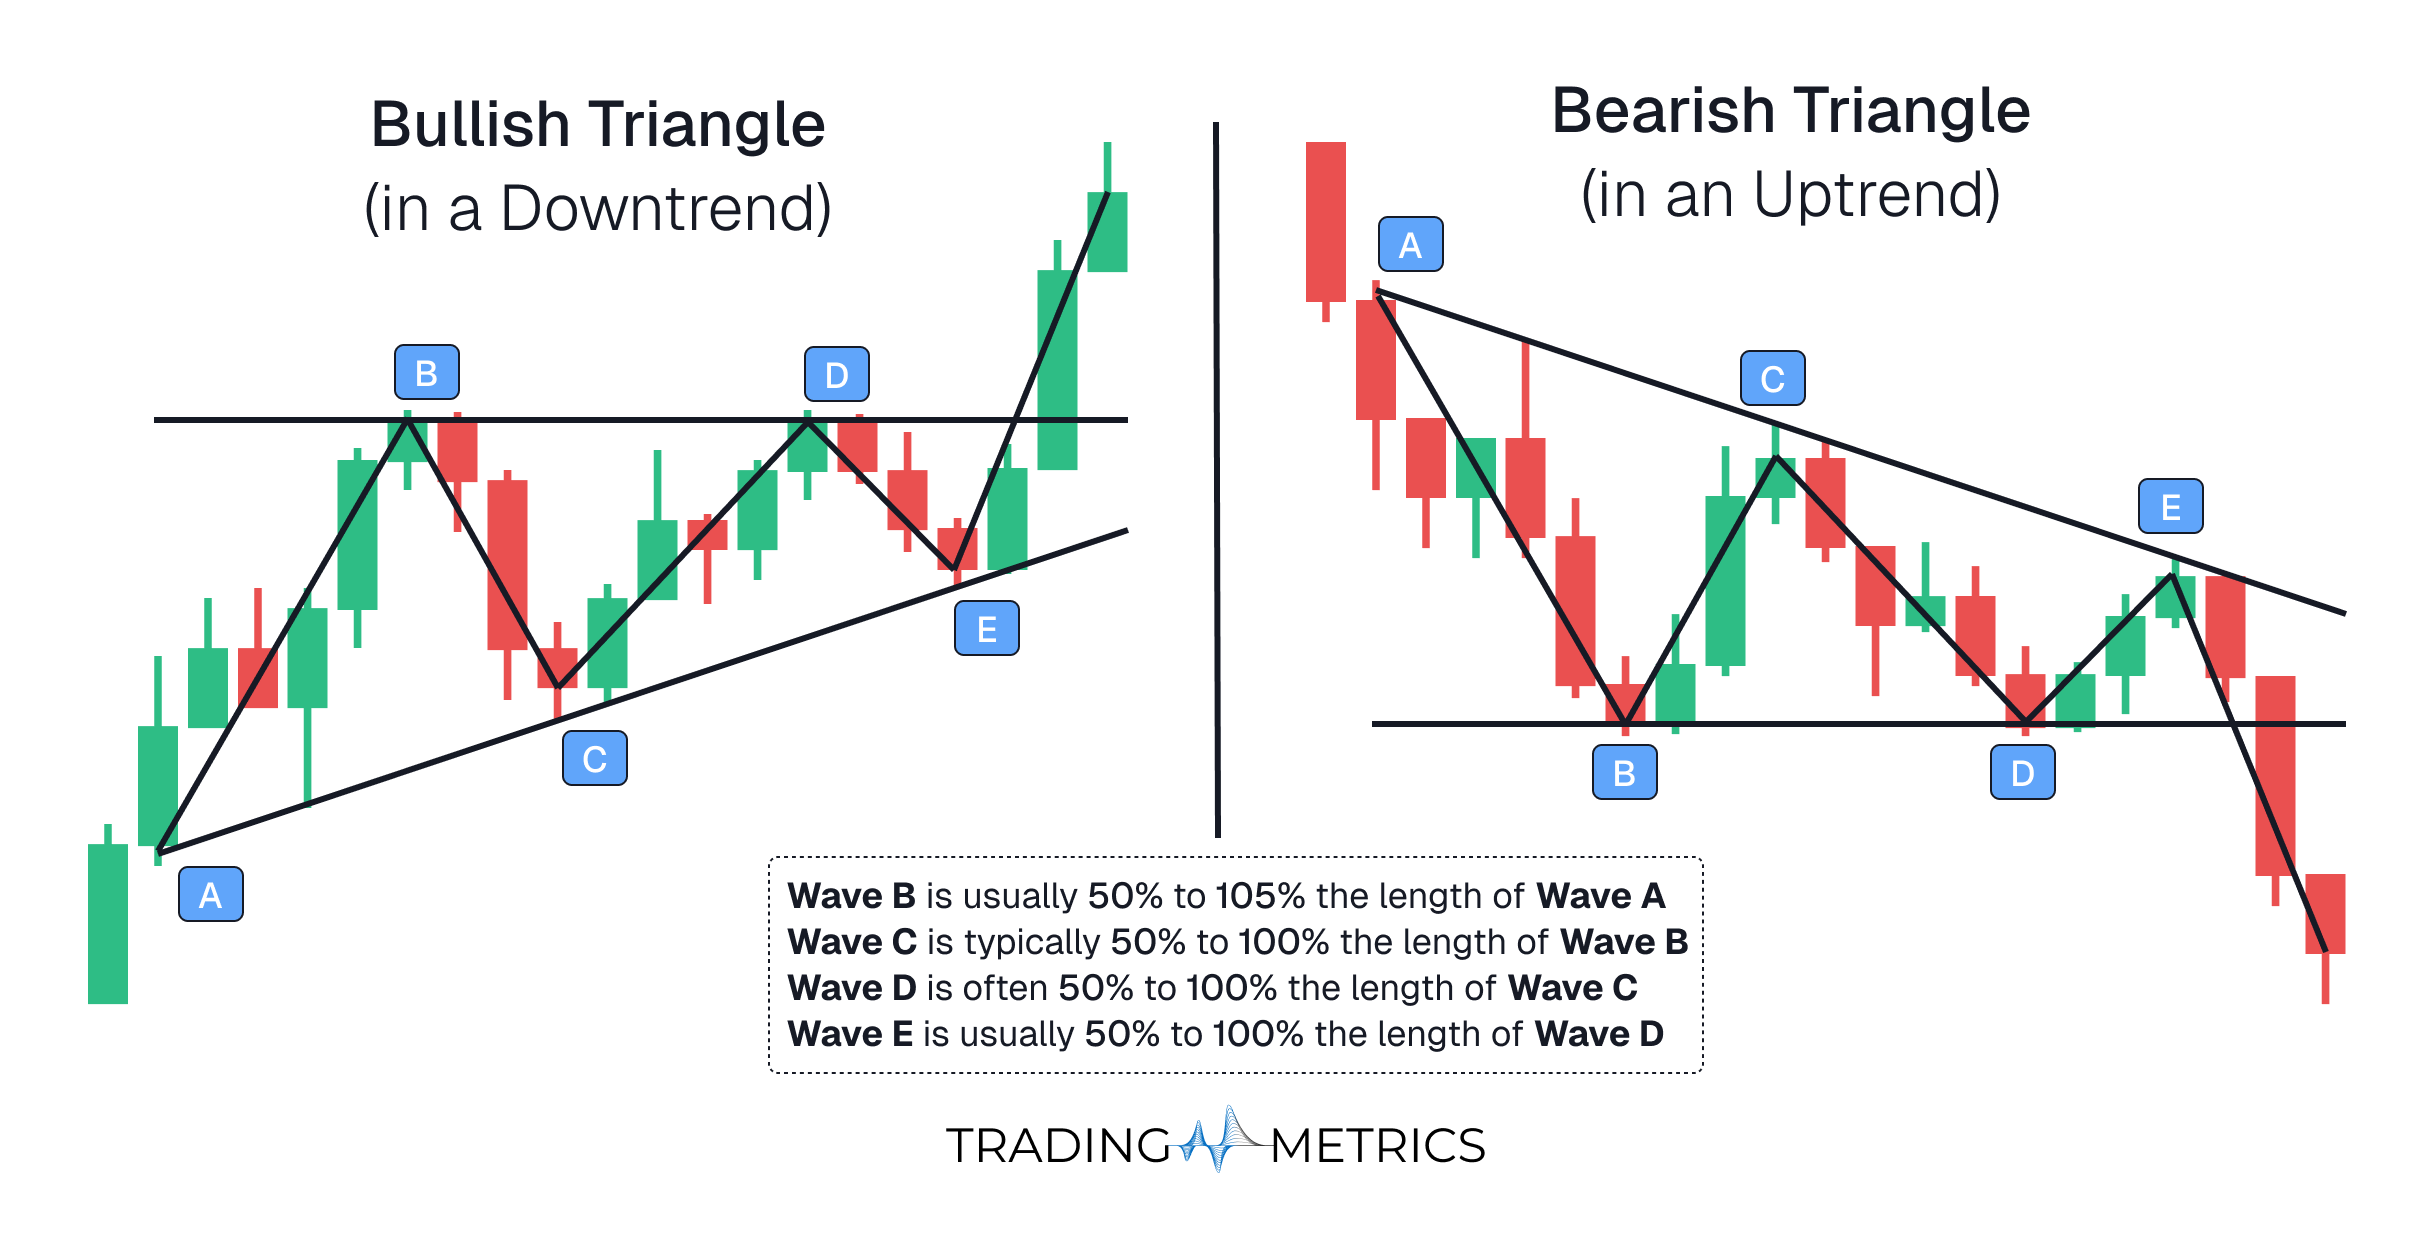
A Triangle is a contracting or sideways consolidation pattern that occurs during a corrective phase within a larger trend. It reflects indecision and reduced volatility, typically appearing before the final move in the trend resumes. Triangles often form in wave 4, wave B, or X waves.
Structure
The Triangle pattern follows a 3-3-3-3-3 wave sequence, labeled A–B–C–D–E:
- Each leg is a 3-wave correction (typically zigzags, flats, or combinations).
- The pattern is bound by two converging trendlines, though some triangles can expand.
- Volume contracts throughout the structure, and momentum wanes.
Triangles are unique in that they unfold over five overlapping 3-wave segments, and they do not advance price significantly until the breakout, making them a sign of pause rather than reversal.
Trading
Triangles offer a setup to trade the breakout after wave E, typically in the direction of the preceding trend.
-
In a bullish Triangle (within a downtrend):
The trader may anticipate an upward breakout after wave E, targeting the final leg of the correction before the downtrend resumes. -
In a bearish Triangle (within an uptrend):
The trader may anticipate a downward breakout after wave E, completing the correction before the uptrend continues.
Key Points
- Triangles are consolidation patterns, not trend reversals.
- Always unfold as a 3-3-3-3-3 sequence (five legs).
- Appear most often in wave 4, wave B, or X waves.
- Wave E is typically the final leg and can end slightly short or beyond trendlines.
- The breakout after wave E is usually sharp and directional.
- Use trendline contraction, momentum divergence, and volume decline as confirmation.
Complex Corrections
When a single corrective structure isn’t enough to relieve the prior trend, the market can combine multiple patterns using connectors (commonly labeled X).
- Wave structure: Multiple A-B-C corrections linked together
- Can be confusing without experience
Corrective waves tend to be less predictable than impulses, but knowing the typical forms and their behavior gives traders a powerful edge when forecasting price behavior during consolidation phases.
How to Draw Elliott Wave? (Modern Method)
Modern Elliott Wave analysis blends classical wave principles with real-time market dynamics and Fibonacci measurements. Here’s a practical step-by-step guide for applying it on your charts.
Identify the Trend Direction
Start by determining the dominant trend using structure, swing highs/lows, or moving averages. You want to draw Elliott Waves in the direction of the larger trend for higher probability setups.
Find the Starting Point of a New Move
Look for a strong impulsive price move that breaks previous structure. This may be the start of Wave 1. A breakout from consolidation with increased volume or momentum is often a good signal.
Label the Impulse (1-2-3-4-5)
Mark five distinct swings in the direction of the trend, following these core rules:
- Wave 2 must not break below the start of Wave 1
- Wave 3 is never the shortest
- Wave 4 should not overlap with Wave 1
Use Fibonacci to Project Wave Lengths
Fibonacci helps validate wave positions:
- Wave 3 often extends to 161.8% the length of Wave 1
- Wave 5 is commonly 61.8% to 100% of Wave 1 or Wave 3
- Wave 2 retraces 50–61.8%
- Wave 4 retraces 23.6–38.2%
Label the Corrective Structure (A-B-C)
Once the five-wave impulse completes, identify a corrective A-B-C structure against the trend. Check if it’s a Zigzag (5-3-5), Flat (3-3-5), or Triangle (3-3-3-3-3).
Zoom Out to Align Wave Degrees
Make sure your wave count fits into the bigger picture. If your impulse is just part of a larger wave, adjust the degree using the proper notation (e.g., Intermediate vs. Minor).
Adjust Labels as Price Evolves
Wave counts can change as the market unfolds. Be flexible, and don’t force the count. Use Fibonacci relationships, alternation, and wave personality to refine your analysis.
Using this structured approach helps traders create logical, adaptable Elliott Wave counts that evolve with real market behavior.
Trade Entry & Exit Planning Using Elliott Waves
Once your wave count is valid, you can build a complete trade plan around it using these principles:
Entry Timing
- Wave 2 End / Start of Wave 3: Enter after a corrective pullback ends near a Fibonacci Retracement (50–61.8%) and confirms reversal with momentum or candlestick signal.
- Wave C Completion: In countertrend setups, enter when Wave C aligns with a key support/resistance zone and shows exhaustion (divergence, wick rejections, etc.).
- Break of Wave B or Wave 1: For confirmation-based entries, wait for price to break the origin of Wave B (in A-B-C) or the high of Wave 1 (in impulsive setups).
Stop Loss Placement
- Below the start of Wave 1 (for impulse trades)
- Beyond the end of Wave B or C (for corrective setups)
- Adjust dynamically if new wave invalidates prior count
Target Setting
- Wave 3 Targets: 161.8% Wave 1 (minimum), sometimes 261.8% in strong trends
- Wave 5 Targets: Equal to Wave 1 or 61.8% Wave 3
- Wave C Targets: Often mirrors length of Wave A or extends 161.8%
Exit Planning
- Exit near Fibonacci extension + key resistance zone
- Watch for divergence or reversal pattern near Wave 5 or C
- Trail stops as new subwaves form or break structure
Elliott Wave provides the structure - combining it with logical risk management and confirmation improves trade quality.
Checklist for Valid Wave Count
Use this checklist to confirm that your Elliott Wave count follows essential rules and guidelines before committing to a trade:
Checking these points helps ensure your analysis is not only structurally sound, but also actionable and grounded in probabilities.
Impulse Wave Trade Example
Analysis
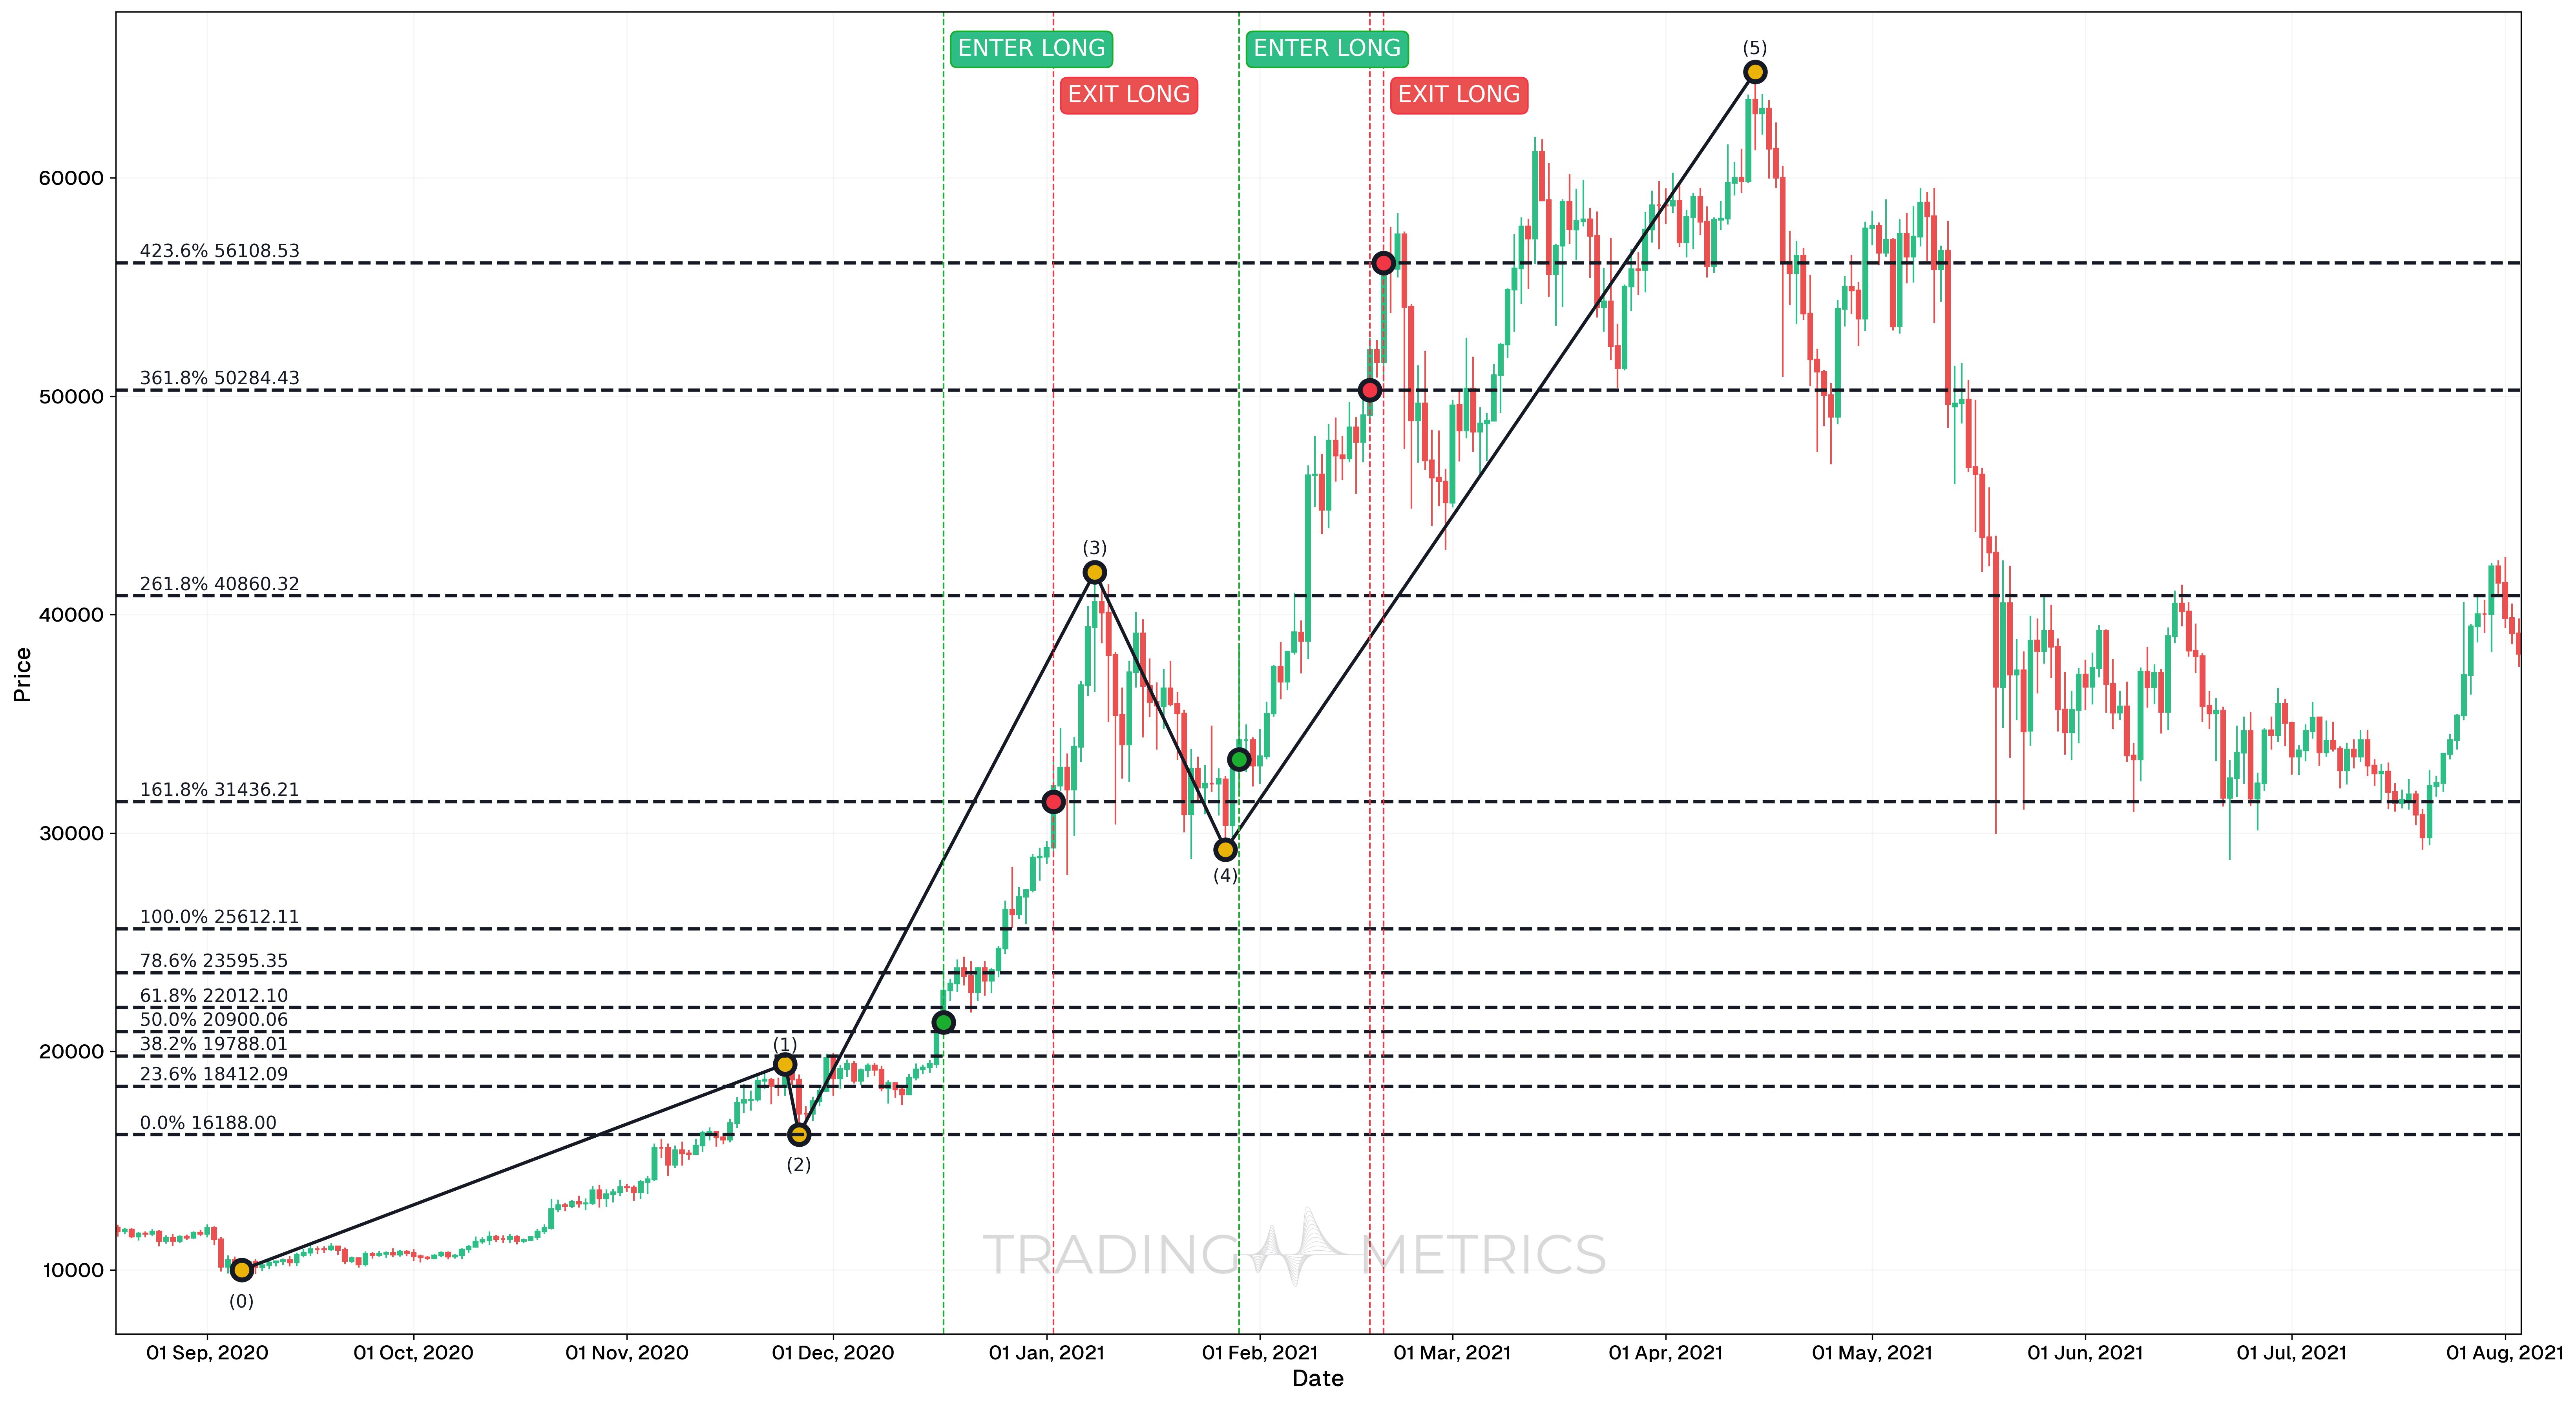
- The trade setup was based on an Elliott Wave impulse formation - clearly showing waves 1, 2, 3, 4, and 5.
- The trade was initiated after Wave 4, capitalizing on the final upward push into Wave 5.
- A break above the 161.8% Fibonacci extension and the Wave 4 peak on January 29, 2021, confirmed strong bullish continuation and served as the entry signal.
- A prior trade was executed on December 17, 2020, in anticipation of early wave structure development, supported by a strong Bullish Engulfing candle and a break above the 50% Fibonacci extension level.
Trade Setup
Trade 1
- Entry: December 17, 2020
- Triggered by a large Bullish Engulfing candle.
- Price broke and closed above the 50% Fibonacci extension level at 20,900.06, confirming bullish strength.
- Exit: January 2, 2021
- Profit was secured ahead of the next consolidation phase and prior to Wave 4 development.
- Stop-loss: Set just below the 50% Fibonacci extension, around 20,900.06, serving as the invalidation point for the bullish breakout.
Trade 2
-
Entry: January 29, 2021
- Price breaking above the 161.8% Fibonacci extension (from Wave 5 start).
- A bullish breakout above Wave 4, signaling the initiation of Wave 5.
- Clear confirmation of bullish strength and Elliott Wave structure integrity.
- Bullish Engulfing pattern prior to trade entry.
-
Exit: The position was closed in two phases to secure gains at major Fibonacci extension targets:
- February 17, 2021: Exit near the 361.8% extension at 50,284.43.
- February 19, 2021: Exit near the 423.6% extension at 56,108.53 (following partial retracement and second target hit).
-
Outcome: Both trades captured key portions of the Elliott Wave cycle - the first targeting the initial momentum breakout, and the second capitalizing on the Wave 5 surge to extended Fibonacci targets.
Risk Management
- Stop-loss Placement:
- For Trade 1: Set just below the 50% Fibonacci extension at 20,900.06, minimizing downside risk from the breakout structure.
- For Trade 2: Set slightly below Wave 4, around the $28,000 level, serving as the key invalidation point for the Wave 5 breakout setup.
- Position sizing: Risk was limited to 1 - 2% of the total account balance in both trades. Trade sizes were calculated based on the respective entry and stop-loss levels.
- Risk-Reward Ratio (First Exit of Trade 2 Only): A strong 1:4.62 ratio, reflecting the strength and momentum of Wave 5 continuation patterns.
- Volume and Wave Confirmation: Increased volume in both entries confirmed bullish intent, particularly during Wave 5’s impulse phase.
- Exit Strategy Flexibility: Each trade featured targeted exits at major Fibonacci levels, balancing profit capture and trend continuation.
- Fibonacci Extension Logic: Extensions were derived using the trend-based method from Wave 1 to Wave 2, projected from the origin of Wave 3 to define high-probability Wave 5 targets.
Corrective Wave Trade Example
Analysis
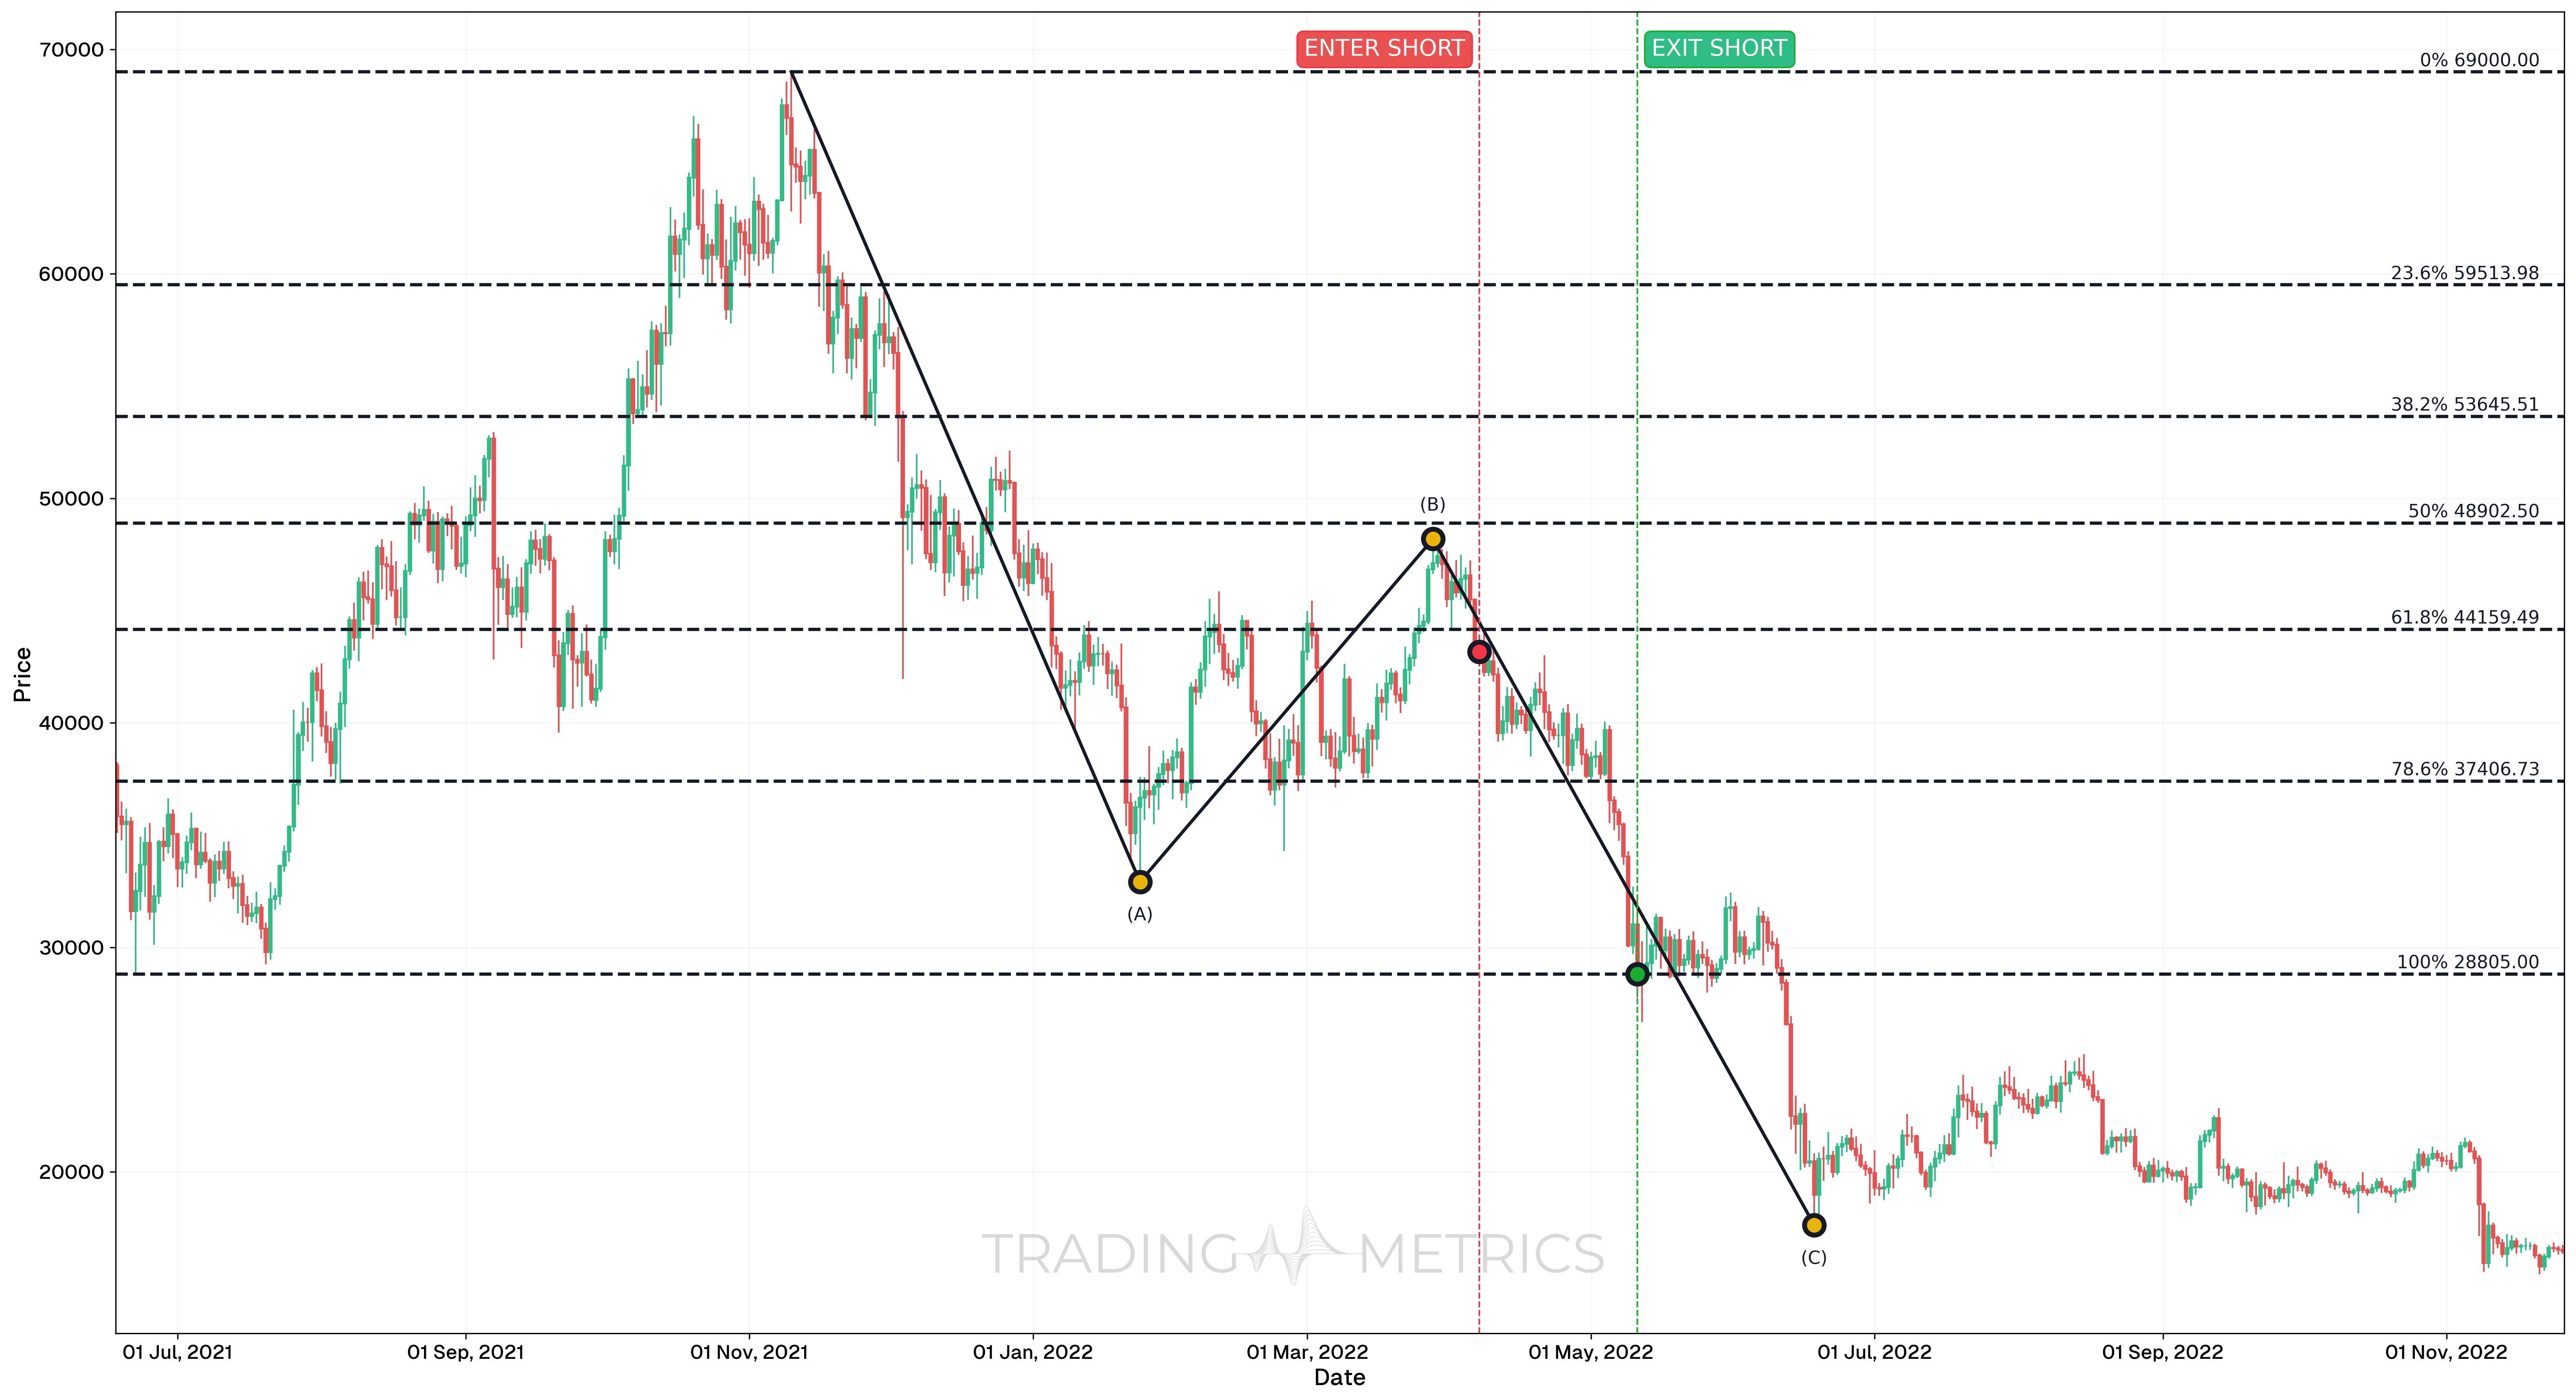
- The trade setup was based on an Elliott Wave corrective formation - specifically a zigzag correction (A-B-C).
- The trade was initiated at the end of Wave B, anticipating the final leg down into Wave C.
- Wave B retraced to the 61.8% Fibonacci level, offering a high-probability short setup within a completed corrective rally.
Trade Setup
-
Entry: On April 7, 2022, a short position was entered due to:
- A clearly defined Wave A and Wave B, forming a typical zigzag corrective structure.
- Price rejection at the 61.8% Fibonacci Retracement level from Wave A.
- Momentum loss and confirmation via bearish candlestick formation near the Fibonacci level.
- Bearish Engulfing candle confirmation
-
Exit: The trade was closed on May 11, 2022, near the 100% Fibonacci Retracement level, which:
- Aligns with the expected termination zone of Wave C in an A-B-C correction.
- Represented a complete retracement of the prior move, fulfilling the pattern.
- Acted as a strong confluence level to take profit before potential reversal.
-
Outcome: The position captured the entire Wave C leg, often one of the sharpest moves in a zigzag correction.
Risk Management
- Stop-Loss Placement: The stop-loss was set just above the 61.8% Fibonacci Retracement level at $44,519.49, slightly below the Wave B high. This level invalidates the short thesis if breached.
- Position sizing: Risk exposure was limited to 1 - % of the account balance. Position size was determined based on the distance between entry and stop-loss.
- Risk-Reward Ratio: The trade offered a strong Risk-Reward Ratio of 1:14.35, consistent with the sharp and impulsive nature of Wave C.
- Corrective Wave Logic: The A-B-C zigzag is a common pattern in corrections, often retracing back to the origin of Wave A - as confirmed in this setup.
- Fibonacci Retracement Application: Levels were plotted from the swing high at the start of Wave A to the low of Wave A, with Wave B peaking at the 61.8% retracement, setting up the short.
- Confirmation Factors: The corrective structure, Bearish Engulfing combined with Fibonacci confluence, bearish price action, and lower highs on volume, supported the short idea.
Combining Elliott Wave Theory with Other Tools
The precision of Elliott Wave Theory improves significantly when paired with complementary indicators and price tools. Traders use the following techniques to validate wave counts and enhance decision-making:
- Fibonacci Levels: Combining Elliott Waves with Fibonacci Retracement and extensions helps project wave targets. For example, Wave 3 often extends to 161.8% the length of Wave 1, and Wave 5 often aligns with 61.8% or 100% Fibonacci projections.
- Relative Strength Index (RSI): Look for Relative Strength Index (RSI) divergence during Wave 5 or Wave C to confirm trend exhaustion. Overbought conditions may signal a reversal near the end of an impulse.
- Moving Averages: Use dynamic trend indicators like the 50 EMA or 200 EMA to validate structure. Wave pullbacks often bounce from these levels, particularly Wave 2 or Wave 4.
- Volume: Strong volume typically accompanies Wave 3, while declining volume in Wave 5 can signal weakness. Watch for volume surges near Wave A or C to anticipate turning points.
- MACD: Look for MACD crossovers or divergence to support your wave count. For example, MACD divergence during Wave 5 can confirm a potential trend reversal or end of cycle.
- Candlestick Patterns: Spot reversal formations like Doji or Engulfing near potential wave completions (e.g., top of Wave 5 or end of Wave C) for added confirmation.
Combining Elliott Wave Theory with these tools provides better confluence, reduces subjectivity, and enhances both precision and timing in real-time market analysis.
Conclusion
Elliott Wave Theory offers a structured way to analyze market cycles by breaking price action into impulse and corrective phases. While it requires practice and flexibility, combining it with tools like Fibonacci, RSI, and volume greatly improves accuracy. When applied with discipline and proper guidelines, Elliott Wave analysis becomes a valuable asset in identifying trend direction, reversal zones, and high-probability trade setups. As with any method, consistent validation and adaptability are key to long-term success.
Frequently Asked Questions
Quick answers based on this page's topic.
Elliott Wave Theory identifies recurring price patterns based on investor psychology. By breaking market movements into five-wave impulses and three-wave corrections, traders can determine the current trend's maturity and anticipate potential reversal points before they occur on the chart.
To maintain a valid count, three rules are absolute: Wave 2 cannot retrace more than 100% of Wave 1, Wave 3 can never be the shortest of the three impulse waves, and Wave 4 cannot enter the price territory of Wave 1.
While highly useful for identifying broad market cycles, Elliott Wave in crypto often features extended fifth waves and deeper corrections. Success requires combining wave counts with other indicators to confirm if a pattern is truly playing out or being invalidated by volatility.