Measured Move Down: Projecting Symmetric Bearish Targets
The Measured Move Down pattern is a methodical bearish continuation signal in technical analysis, often observed during a downtrend. Visualize it as a two-leg descent - price drops, consolidates, then drops again by a similar distance - charting a predictable fall. When this pattern emerges, it’s a precise indicator that bearish momentum is poised to repeat, offering traders an opportunity to sell or short the asset as the downtrend plunges deeper.
How to Identify the Measured Move Down Pattern in Trading
The Measured Move Down is a bearish continuation formation. It develops in three phases: a sharp decline, a consolidation pause, and a second decline of similar size. The setup confirms when price breaks below the consolidation low. Here’s how to spot it:
Start with the Big Picture
This pattern forms during a downtrend. Sellers drive price lower, then the market pauses briefly before continuing with another leg of equal strength.
Trace the Three Phases
The structure unfolds in a clear three-part sequence. Recognizing each stage confirms the setup.
- First Leg: A sharp downward move establishing the initial thrust.
- Consolidation: A sideways or slight retracement phase, often taking the shape of a rectangle, flag, or triangle.
- Second Leg: A fresh decline projected to mirror the first leg in size, beginning once consolidation breaks.
Zero in on the Breakdown Level
The breakdown level is the consolidation’s low. Price must close below this level to confirm the second leg is underway.
Watch the Breakdown
The bearish trigger comes when price closes below the consolidation low.
- A decisive break under support or
- A large bearish candle
Both confirm continuation of the downtrend and provide the entry.
Check Volume for Additional Confirmation
Volume activity strengthens the signal.
- Spikes on the first leg as sellers dominate.
- Declines during consolidation as the market pauses.
- Surges on the breakdown, confirming renewed selling momentum.
Measure the Drop: Measure the height of the first leg (from high to low) and project it downward from the consolidation breakdown for a precise price target.
How to Trade the Measured Move Down Pattern (Trading Example)
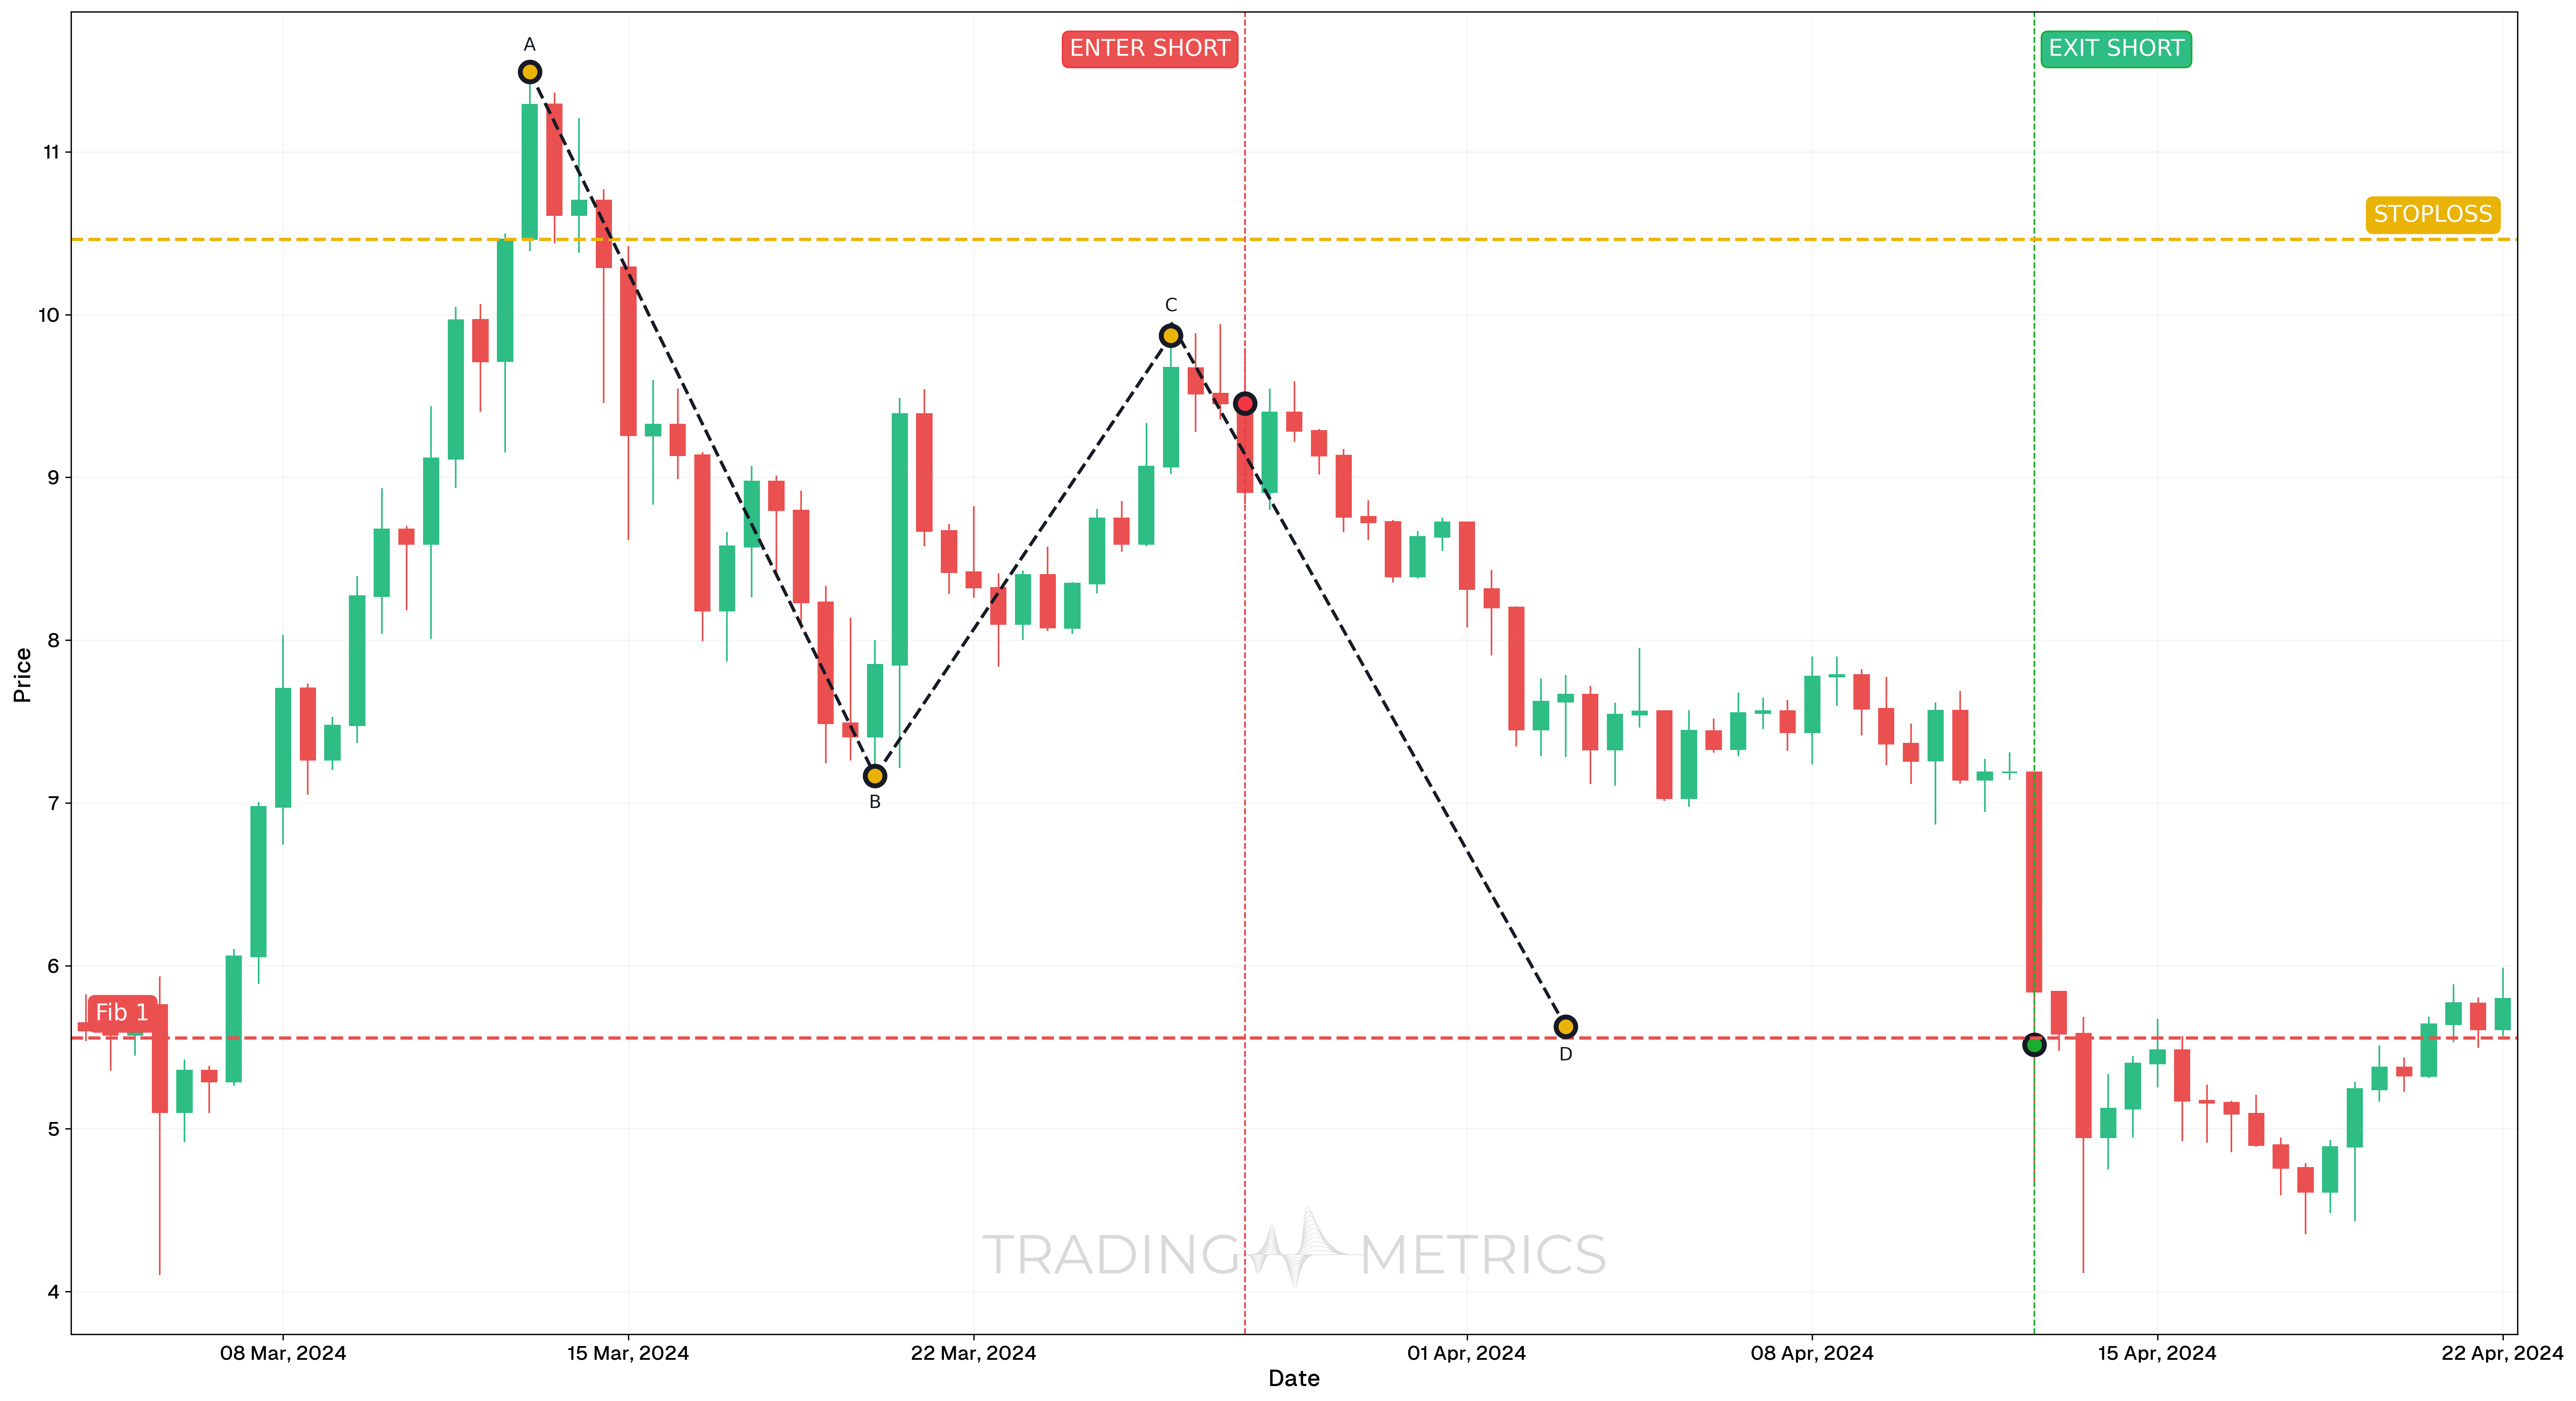
To demonstrate the Measured Move Down pattern, we’ll examine the RUNEUSDT Perpetual pair on the 12-hour chart. This example captures a textbook three leg bearish continuation setup that unfolded over several weeks in March-April 2024.
Analysis
After a steep drop from early March, RUNEUSDT entered a consolidation phase with a slight bullish recovery. However, when the second Bearish Harami formed and aligned with higher-timeframe weakness, a trend continuation setup became clear. This confirmed the full Measured Move Down structure: Wave A-B (drop), Wave B-C (correction), and the final Wave C-D (impulsive drop).
Trade Setup
-
Entry: The position was taken on March 27, 2024 at 12:00, at $9.454, after confirmation of the second Bearish Harami pattern. The reasoning behind this timing:
- The first Bearish Harami was ignored due to ongoing bullish structure on higher timeframes.
- The second Bearish Harami, however, aligned with a shift toward bearish momentum, signaling a likely trend reversal and continuation of the larger downtrend.
- This confirmed the start of Wave C, the final leg in the measured move.
-
Exit: The trade was exited on April 12, 2024, at $5.516, once the projected length of Wave A was fulfilled from Wave C, validating the Measured Move Down structure.
-
Outcome: The pattern produced a high-quality bearish continuation trade, with price completing the projected leg almost precisely.
Risk Management
- Stop-Loss placement: Stop-loss was placed at $10.461, just above the recent corrective high near the Bearish Harami formation. This invalidation point protected against failed continuation.
- Risk-Reward Ratio: 1:3.91 risk-reward profile was highly favorable. The distance between entry and stop-loss was relatively small compared to the projected downside target, making this a strong continuation opportunity.
- Position sizing: Trade size was calculated using a 2% capital risk model, with risk measured between entry and stop-loss.
- Volatility Consideration: Volatility contracted during the correction and expanded sharply after the bearish breakout, confirming momentum for the final wave.
- Confirmation Logic: Waiting for the second bearish reversal candle and higher timeframe alignment improved signal quality and reduced early entry risk.
Volume Surge: A volume spike on the breakdown drives the pattern into a bearish plunge.
Pre-Trade Checklist
Measure the Proof: Pair the pattern with volume spikes and indicators like RSI to dodge fakes and boost your odds.
Key Points
- Leg Symmetry: The second leg mirroring the first boosts accuracy - mismatched moves dilute it.
- Time Frame: Shines on daily or weekly charts in active downtrends.
- Combine with Indicators: Use moving averages or RSI to confirm the breakdown.
- Breakout Confirmation: The break below consolidation low sets the second leg - don’t jump too soon.
- Price Target: Measure the first leg height, project down from the breakdown for your target.
- Risk Management: Set a stop-loss above the consolidation high to limit losses if it fails.
Wait for the Break: Acting before the breakdown risks a mismeasured trap - let the second leg fall.
Conclusion
The Measured Move Down pattern is a trader’s methodical tool for riding bearish continuations. Its two-leg structure, paired with volume, RSI, and moving averages, can map out big drops. Whether in crypto, stocks, or forex, this pattern sharpens your edge. Stay patient, manage your risk, and let the move measure down - that second plunge could fall into a winning trade.
Frequently Asked Questions
Quick answers based on this page's topic.
This pattern uses the principle of 'Leg Symmetry.' By measuring the vertical distance of the first impulsive drop (Leg 1) and projecting that same distance downward from the top of the corrective bounce, traders can find a mathematical goal for the next decline.
The consolidation acts as a 'reset' for the trend. It represents a temporary equilibrium where buyers attempt to stall the fall. For a reliable setup, this correction should ideally retrace between 38.2% and 50% of the first leg before sellers re-enter.
Yes. Volume should ideally surge during the first and second legs of the move, indicating aggressive distribution. During the middle consolidation phase, volume should contract, confirming that the rally lacks institutional conviction and is merely a pause in the downtrend.