Trading the Bearish Crab Pattern: Professional Reversal Tactics
The Bearish Crab Pattern is a meticulous bearish reversal signal in technical analysis, often clawing its way down from the heights of an uptrend. Picture it as a harmonic stretch - price tracing an XABCD structure with extreme Fibonacci ratios - snapping back from extended bullish territory to bearish strength. When this pattern forms, it’s a precise sign that bullish momentum has overextended, offering traders a chance to sell or go short as a downtrend emerges with force.
How to Identify the Bearish Crab Pattern in Trading
The Bearish Crab Pattern is one of the most extreme harmonic reversal signals. Picture the market driving upward in a relentless push, stretching into deep Fibonacci territory far beyond typical retracements. That overextension is where buyers lose control and sellers strike. Here’s how to spot it:
Start with the Big Picture
This pattern forms after a strong uptrend. Bulls dominate early, but the Bearish Crab highlights when the rally has gone too far. Its extreme Fibonacci extension marks a high-probability turning point.
Trace the XABCD Legs
The structure is defined by five swings, each tied to strict Fibonacci measurements. Spotting these ratios confirms the pattern’s validity.
- XA: The initial sharp rally that sets the stage.
- AB: A retracement down into 38.2%–61.8% of XA.
- BC: Another rally upward, retracing 38.2%–88.6% of AB without breaking above X.
- CD: A deep extension upward into the 161.8% extension of XA, often aligning with the 261.8%–361.8% projection of BC.
- D Point: The completion of the Bearish Crab, and the zone where a reversal is expected.
Zero in on D (the Reversal Zone)
D is the exhaustion point. It combines the 161.8% extension of XA with the extreme BC projection range (261.8%–361.8%). This confluence creates the PRZ (Potential Reversal Zone), where the odds of reversal are highest.
Watch the Breakdown
Confirmation comes when price fails at D and reverses downward.
- A sharp bearish candle or
- A close below B
Both confirm that buyers are trapped and sellers are stepping in. That’s your entry trigger.
Check Volume for Additional Confirmation
Volume helps verify that the reversal is real.
- Strong activity on XA (bulls aggressive).
- Lighter on AB and BC (pause in momentum).
- Then a spike at D as sellers strike back.
When that surge appears, the Bearish Crab’s bearish reversal carries weight.
Drop Claw: Measure the XA leg height and project it downward from D, or target the 38.2% or 61.8% retracement of XD for a realistic price target.
How to Trade the Bearish Crab Pattern (Trading Example)
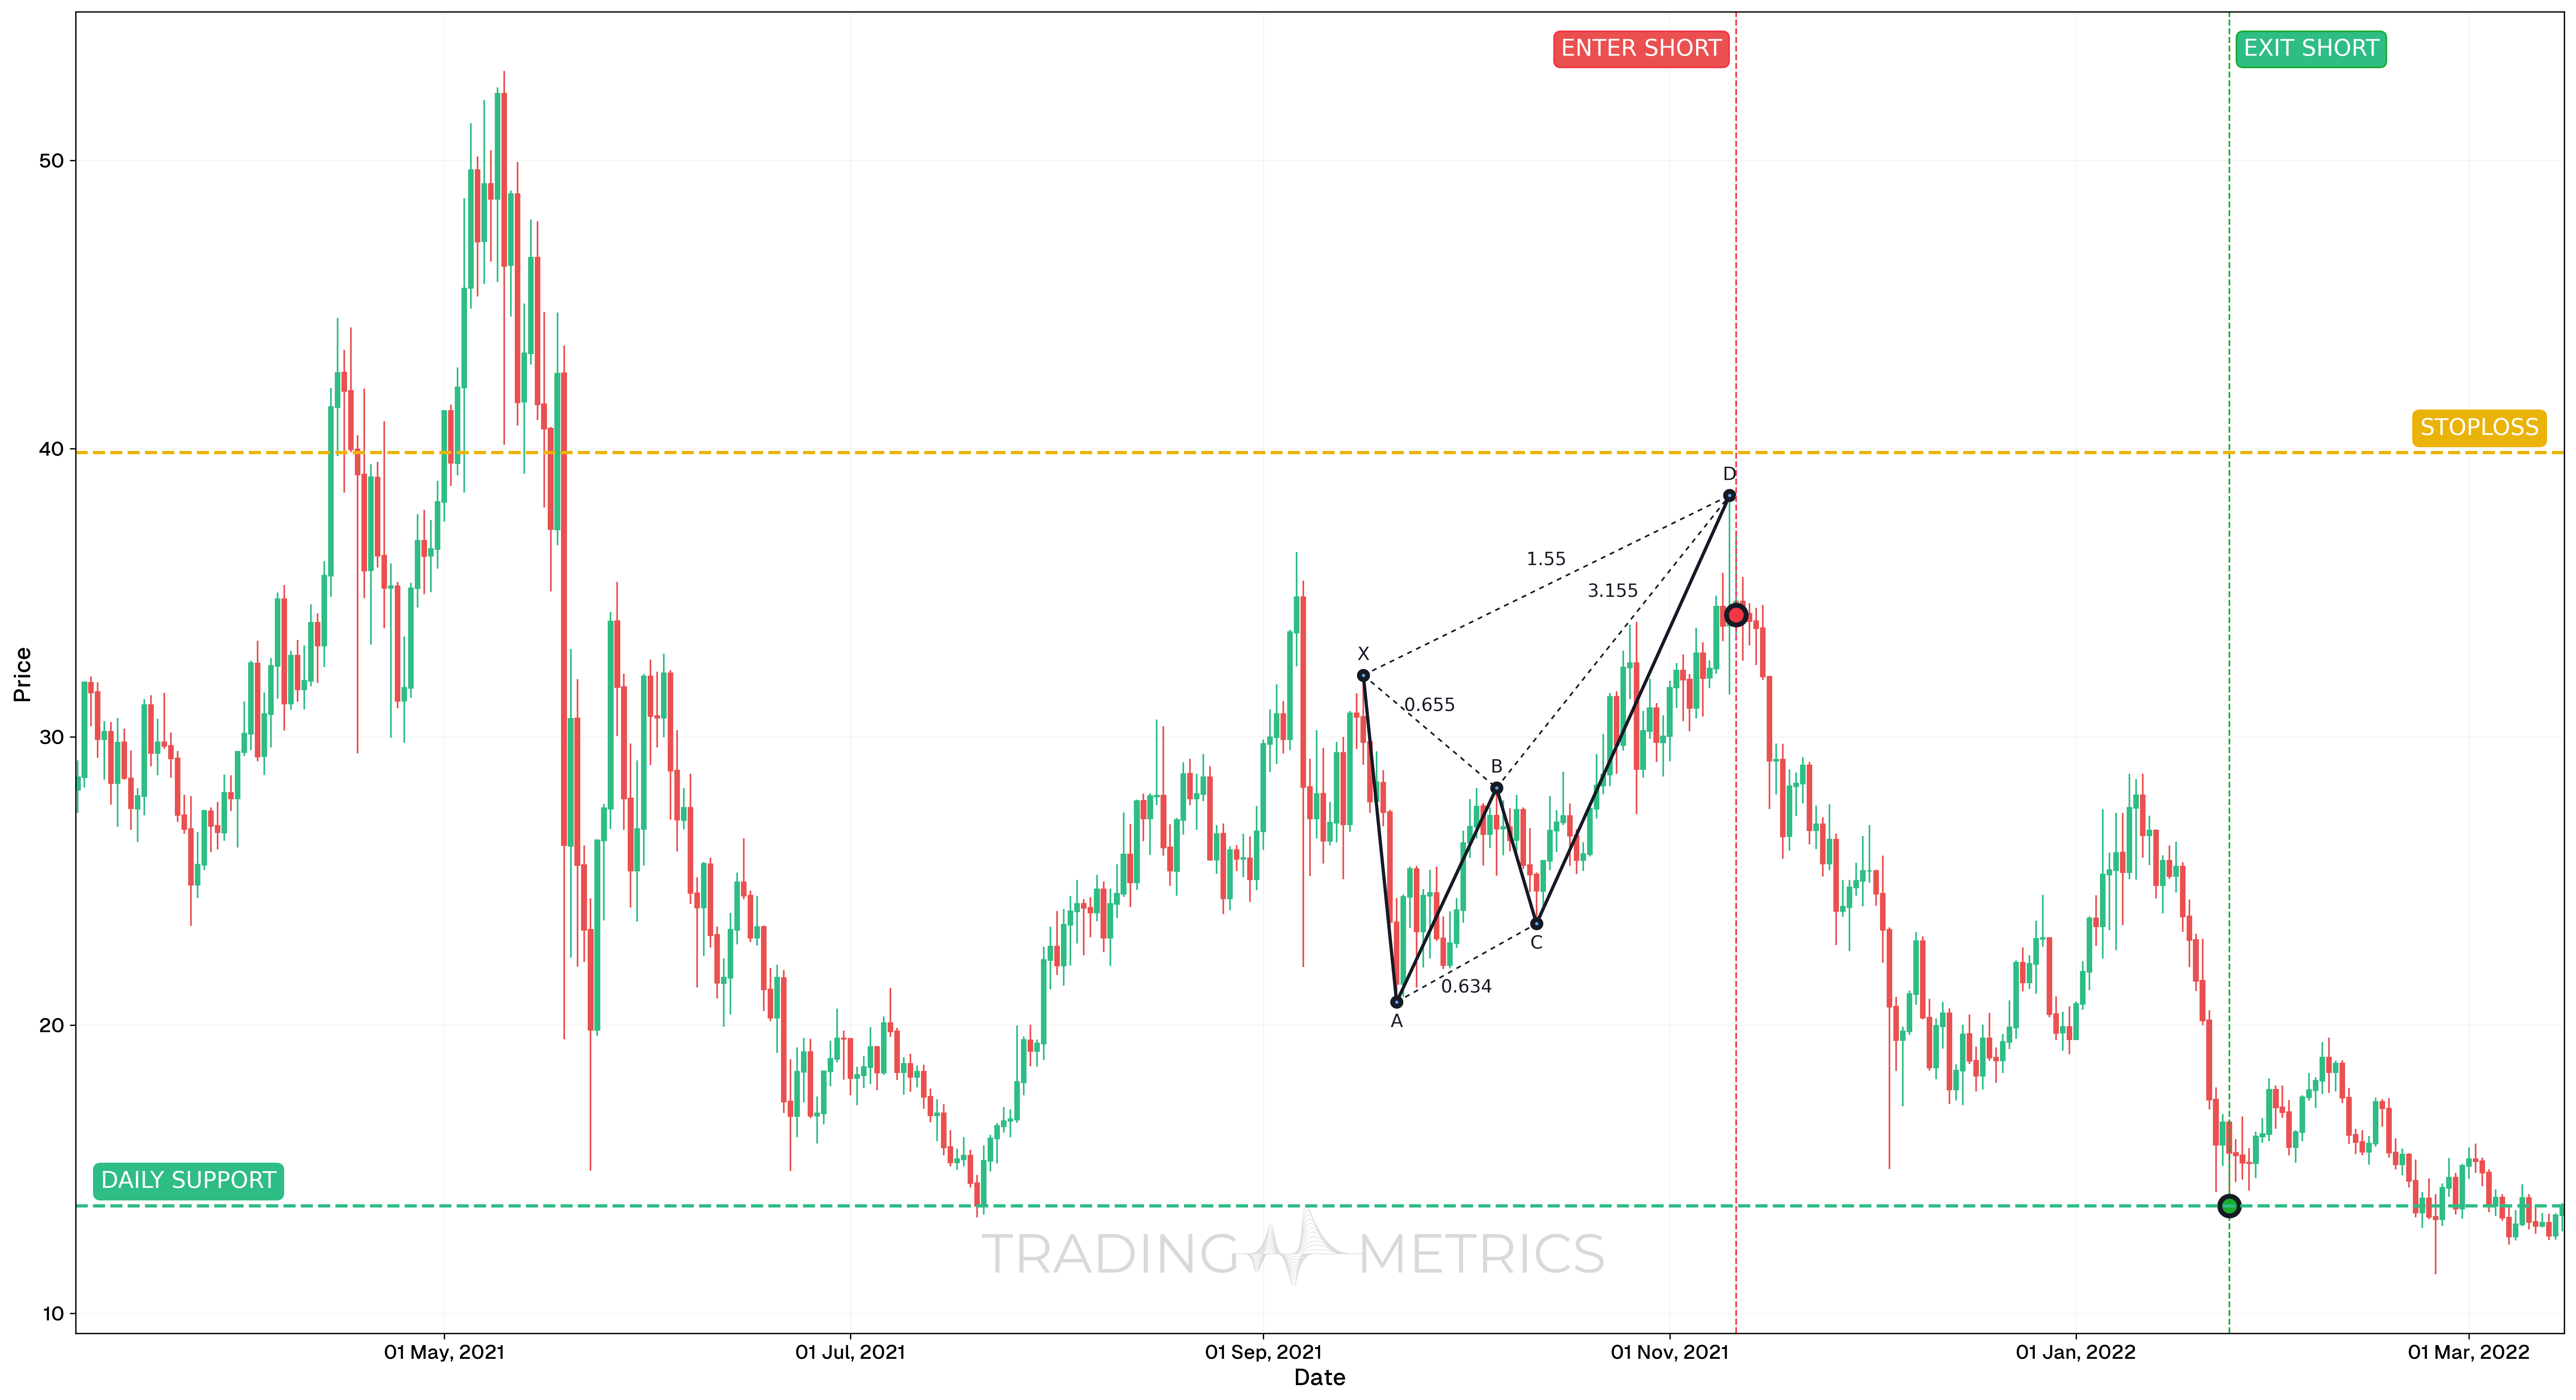
To demonstrate how the Bearish Crab harmonic pattern can be traded, we’ll analyze the LINKUSDT Perpetual chart on the daily timeframe. This pattern appeared after a strong bullish advance and signaled a potential trend reversal near the PRZ (Potential Reversal Zone).
Analysis
From March 2021 to March 2022, LINKUSDT Perp formed a textbook Bearish Crab harmonic pattern. After reaching the extended 1.618 Fibonacci extension on the CD leg, price began to stall and reverse. This coincided with significant momentum divergence and clear signs of exhaustion.
At the PRZ (Potential Reversal Zone) near $34.23, the following signals confirmed bearish intent:
- RSI was falling, indicating weakening bullish pressure
- StochRSI had crossed down and was falling
- The price structure showed a clean rejection after a failed breakout attempt
Trade Setup
-
Entry: The short trade was entered at $34.234 on November 11, 2021, following:
-
Exit: The trade was closed at $13.73 on January 24, 2022, after reaching a key daily support zone, where price stabilized temporarily.
-
Outcome: The Bearish Crab predicted a significant reversal, and the trade captured the full downside move with a clean technical exit.
Risk Management
- Stop-Loss placement: The stop-loss was placed above the pattern’s PRZ (Potential Reversal Zone) at $39.86, just beyond the extreme point D.
- Risk-Reward Ratio: 1:3.65 is favorable ratio was made possible by the precision of harmonic targeting and waiting for confirmation before entry.
- Position sizing: The position used a 2% capital risk model, calibrated based on the entry-stop distance.
- Volatility Consideration: Volatility was elevated leading into the PRZ (Potential Reversal Zone). The entry was delayed until signs of fading momentum were confirmed.
- Adaptive Exit Strategy: A fixed target at daily support provided a high-probability exit, though alternative approaches could have included partial profit-taking at Fibonacci Retracement zones.
Volume Claw: A volume spike at D with confirmation claws the pattern into a bearish surge.
Pre-Trade Checklist
Claw the Proof: Pair the pattern with volume spikes and indicators like RSI to dodge fakes and boost your odds.
Key Points
- Fibonacci Precision: Extreme ratios (38.2%-61.8% AB, 38.2%-88.6% BC, 161.8% XA) boost reliability - loose fits dilute it.
- Time Frame: Claws deepest on daily or weekly charts after uptrends.
- Combine with Indicators: Use moving averages or RSI to confirm the reversal.
- Breakdown Confirmation: A close below B sets the turn - don’t jump at D alone.
- Price Target: Measure the XA leg or apply Fibonacci Retracements of the CD leg (from D) for downside targets.
- Risk Management: Set a stop-loss above D to limit losses if it fails.
Wait for the Claw: Acting before confirmation risks a Bearish Crab trap - let the reversal snap.
Conclusion
The Bearish Crab Pattern is a trader’s meticulous tool for catching bearish reversals. Its XABCD stretch, paired with volume, RSI, and moving averages, can claw into deep gains. Whether in crypto, stocks, or forex, this pattern sharpens your edge. Stay precise, manage your risk, and let the Bearish Crab strike - that deep harmonic snap could drop into a winning trade.
Frequently Asked Questions
Quick answers based on this page's topic.
The Crab is the most 'stretched' harmonic pattern, requiring price to reach an extreme 161.8% extension of the XA leg at point D. It signals that an uptrend has moved too far, too fast, creating a high-probability 'exhaustion top' for institutional-sized reversals.
The primary difference is the depth of the D-point. While a Butterfly completes at the 127.2% extension, the Crab requires a deeper 161.8% push. Additionally, the Crab allows for more flexibility at point B (ranging from 38.2% to 61.8%), whereas the Butterfly is rigid at 78.6%.
Traders typically target the 38.2% and 61.8% Fibonacci retracement levels of the entire AD move. Because the Crab identifies such extreme overextension, the resulting reversal is often swift and sharp as traders who were late to the uptrend rush to exit.