Trading the Bearish Gartley Pattern: Advanced Technical Analysis
The Bearish Gartley Pattern is a classic bearish reversal signal in technical analysis, often appearing at the end of an uptrend. Picture it as a harmonic blueprint - price tracing an XABCD structure with precise Fibonacci ratios - shifting from bullish advance to bearish descent. When this pattern forms, it signals weakening bullish momentum, creating a potential opportunity to sell or go short as a new downtrend emerges.
How to Identify the Bearish Gartley Pattern in Trading
The Bearish Gartley Pattern is a well-known harmonic reversal setup. Picture the market rallying, pulling back, bouncing again, and then slipping — all while respecting Fibonacci balance. At the final touch, buyers lose steam and sellers take over. Here’s how to spot it:
Start with the Big Picture
This pattern forms during a strong uptrend. Buyers dominate, but the harmonic ratios highlight where exhaustion sets in. The Bearish Gartley reveals the turning point near the peak.
Trace the XABCD Legs
The Bearish Gartley consists of five precise swings, each tied to Fibonacci rules:
- XA: The initial strong rally that sets the foundation.
- AB: A retracement down into 61.8% of XA.
- BC: A rally upward, retracing 38.2%–88.6% of AB without breaking above X.
- CD: A decline into the 78.6% retracement of XA, often aligning with a 113%–161.8% projection of BC.
- D Point: The completion of the Bearish Gartley and the Potential Reversal Zone (PRZ).
Zero in on D (the Reversal Zone)
Point D is the critical pivot. It completes the structure at the 78.6% retracement of XA, reinforced by the BC projection range (113%–161.8%).
This confluence builds the PRZ (Potential Reversal Zone) — the hotspot where the uptrend is most likely to fail.
Watch the Breakdown
Confirmation comes when price rejects D and pushes lower:
- A sharp bearish candle, or
- A close below B.
Both confirm that sellers are stepping in — this is your entry trigger.
Check Volume for Additional Confirmation
Volume strengthens the signal:
- Strong on XA (buyers in control).
- Lighter on AB and BC (momentum fades).
- A surge at D signals sellers reclaiming control.
When that spike appears, the Bearish Gartley’s bearish reversal is validated.
Fall Balance: Measure the XA leg height and project it downward from D, or target the 38.2% or 61.8% retracement of the CD leg for a realistic price target.
How to Trade the Bearish Gartley Pattern (Trading Example)
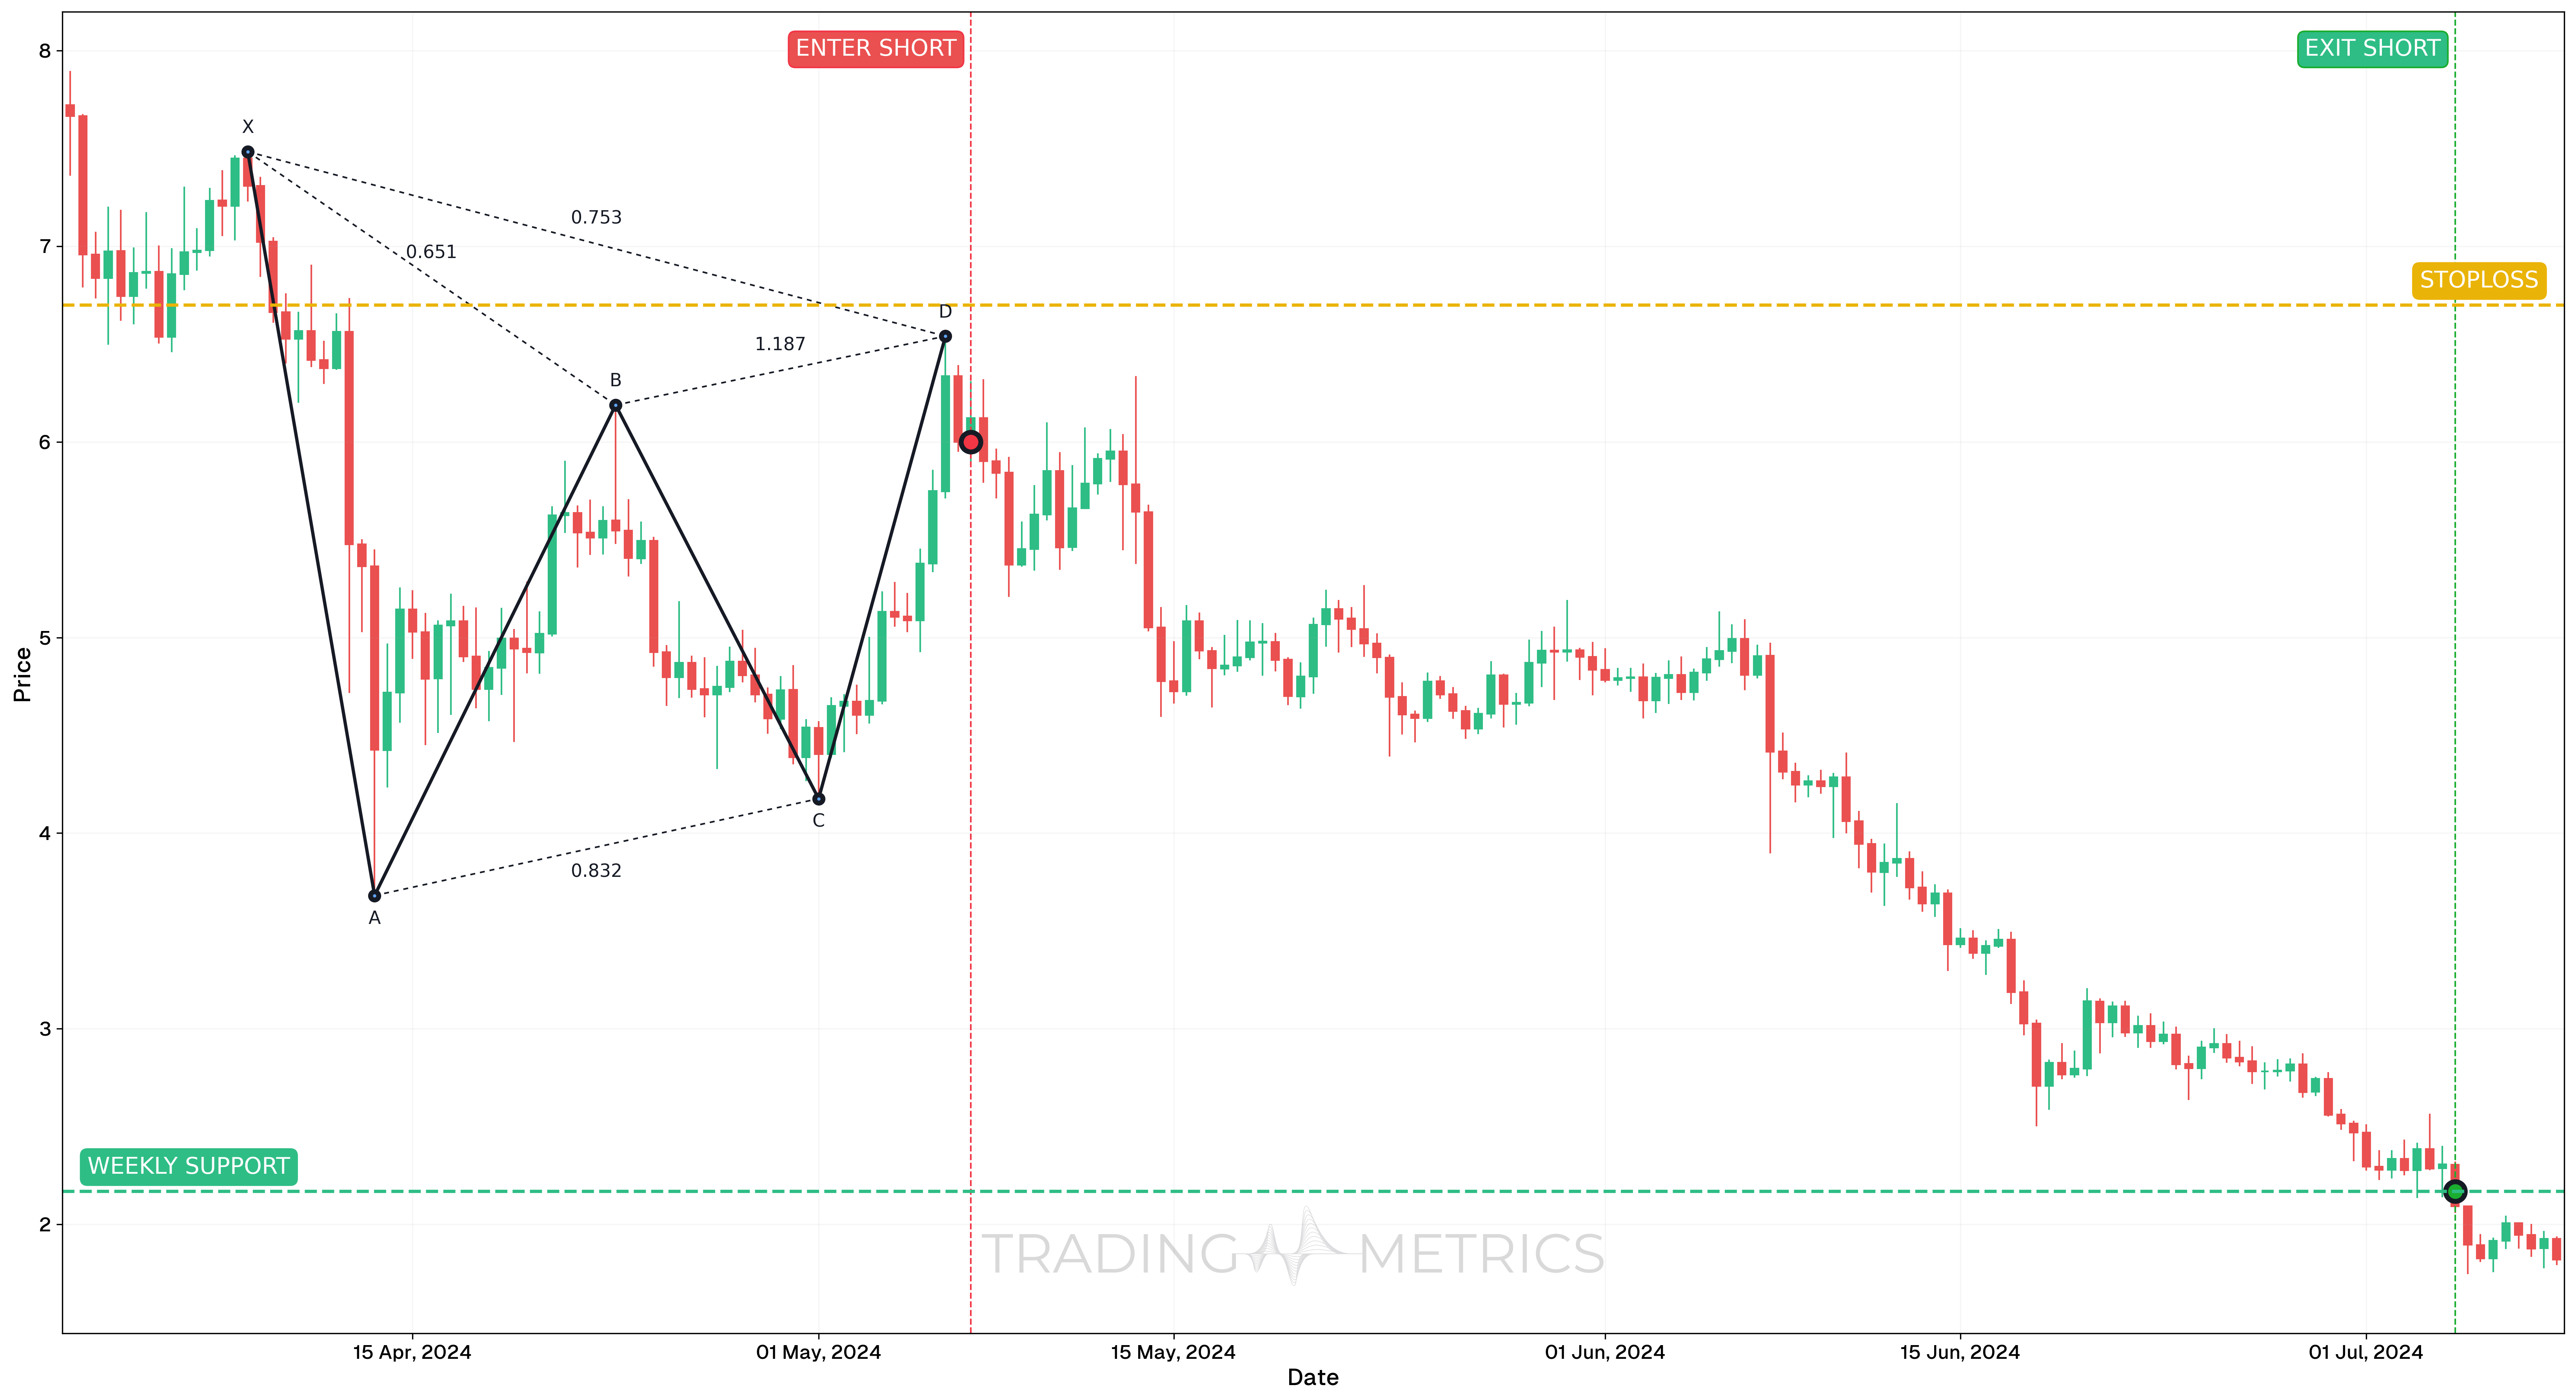
To illustrate a real-world Bearish Gartley pattern trade, we’ll examine the WLDUSDT pair on the 12-hour chart. This harmonic reversal structure appeared after an extended rally, offering a high-probability short setup near the completion of the pattern.
Analysis
Between April 1 and July 8, 2024, WLDUSDT formed a textbook Bearish Gartley pattern. This structure consisted of symmetrical Fibonacci legs (X-A, A-B, B-C, and C-D), with the final leg completing at a confluence zone of technical resistance and harmonic projections. The completion zone provided an ideal entry area for a short position.
Trade Setup
-
Entry: The short trade was initiated on July 4, 2024, at 12:00, at $6.00, as price reached the D-point of the pattern, completing the final harmonic leg. Entry signals included:
- Clean confluence of Fibonacci ratios at point D
- Overextension from previous support structure
- Momentum Indicators showing early signs of exhaustion
-
Exit: The position was closed at $2.169, near weekly support.
-
Outcome: The Bearish Gartley pattern led to a deep retracement, hitting support with strong reward relative to risk.
Risk Management
- Stop-Loss placement: Stop-loss was placed at $6.698, just above the pattern invalidation zone and beyond point X to allow room for pattern volatility.
- Risk-Reward Ratio: 1:5.49 which means the setup offered a highly favorable Risk-Reward Ratio, with the downside target (support zone) far outweighing the limited risk above point X.
- Position sizing: Calculated based on a 2% capital risk model, using the distance between the entry and stop-loss.
- Volatility Consideration: The pattern formed during a moderate Volatility phase, increasing the reliability of the harmonic setup and allowing for better control over Slippage and stop placement.
- Confluence Factors: The trade was supported by harmonic ratios, technical resistance levels, and momentum exhaustion - improving the edge of the setup.
Volume Balance: A volume spike at D with confirmation drops the pattern into a bearish swing.
Pre-Trade Checklist
Key Points
- Fibonacci Precision: Exact ratios (61.8% AB, 38.2%-88.6% BC, 78.6% XA) boost reliability - loose fits dilute it.
- Time Frame: Balances strongest on daily or weekly charts after uptrends.
- Combine with Indicators: Use moving averages or RSI to confirm the reversal.
- Breakdown Confirmation: A close below B sets the turn - don’t jump at D alone.
- Price Target: Measure the XA leg or use Fibonacci Retracements of XD for targets below the close.
- Risk Management: Set a stop-loss above D or C to limit losses if it fails.
Wait for the Balance: Acting before confirmation risks a Bearish Gartley trap - let the reversal align.
Conclusion
The Bearish Gartley Pattern is a trader’s classic tool for catching bearish reversals. Its XABCD blueprint, paired with volume, RSI, and moving averages, can balance into strong downside moves. Whether in crypto, stocks, or forex, this pattern sharpens your edge. Stay precise, manage your risk, and let the Bearish Gartley align - that harmonic shift could drop into a winning trade.
Frequently Asked Questions
Quick answers based on this page's topic.
The Bearish Gartley is defined by two mandatory ratios: a 61.8% B-point retracement of the XA leg and a 78.6% D-point retracement. This specific 'M-shape' geometry signals a classic corrective rally within a larger downtrend that is ready to resume.
While they look similar, the Gartley is less deep. A Gartley completes at a 78.6% retracement of XA, while the Bat goes deeper to 88.6%. Additionally, the Gartley requires a precise 61.8% B-point, whereas the Bat uses a shallower 38.2% to 50% B-point.
A 'Perfect Gartley' requires the AB leg to be equal in price and time to the CD leg. This symmetry adds a layer of time-based confluence to the Fibonacci levels, making the reversal at point D significantly more reliable for traders.