Average True Range (ATR): Sizing Trades for Real Volatility
The Average True Range (ATR) is a technical analysis tool that measures market volatility by decomposing the entire range of an asset price for that period. Developed by J. Welles Wilder, ATR helps traders understand how much an asset typically moves over a given time frame, thus providing insight into the market’s volatility. Essentially, ATR tells you how “wild” a ride you might expect from a particular stock, crypto, or other assets.
In markets, range is the language of volatility. Learn to read it, and you’ll survive.
- Anonymous
How to Calculate ATR?
The Average True Range (ATR) is calculated using the following steps:
Calculate the True Range (TR)
The True Range (TR) for a period is the greatest of the following three values:
Calculate the Average True Range (ATR)
The ATR is the moving average of the True Range (TR) over a specified number of periods (typically 14):
Where is the number of periods.
Volatility Gauge: ATR measures market volatility, helping you adjust position sizing and risk management strategies accordingly.
How to Use ATR?
Understanding how to implement ATR into your strategy can make the difference between getting prematurely stopped out of a trade or giving your trade the right amount of breathing room to succeed. Here’s a step-by-step guide on how to leverage ATR for your stop-loss placements.
Calculate the ATR
The first step in using ATR for setting stop-losses is to calculate it. The ATR measures market volatility by averaging the range between the high and low prices of an asset over a specific period. A 14-period ATR is commonly used, as it provides a balance between responsiveness and stability. However, depending on your trading style - whether you’re a day trader or a swing trader - you might choose a shorter or longer period to better fit your strategy.
A 7-period ATR might be used for a more aggressive approach, while a 21-period ATR could be employed for a more conservative strategy.
Determine the Multiplier
Once you have the ATR, the next step is to determine your multiplier. The multiplier essentially dictates how much room you want to give your trade before it hits the stop-loss. A typical multiplier ranges between 1.5 to 3 times the ATR, though this can vary based on the asset’s volatility and your personal risk tolerance.
Set the Stop-Loss
After determining your ATR and multiplier, you can now set your stop-loss. The process is straightforward:
Long Position
Subtract the ATR multiple from your entry price.
This gives you a stop-loss level that accounts for the expected volatility and keeps your trade safe from the normal ups and downs of the market. For example, if you enter a long position at $100 with a 14-day ATR of $2 and use a 2x multiplier, your stop-loss would be set at $96:
Short Position
Add the ATR multiple to your entry price.
This ensures that your stop-loss is positioned above the entry point, protecting your trade in the event the market moves against your short position. Using the same example, if you’re shorting at $100 with a 14-day ATR of $2 and a 2x multiplier, your stop-loss would be $104:
Adjust Over Time
Continuously monitor and adjust your stop-loss as the ATR changes with market conditions to ensure that it remains relevant.
Avoid Static Strategies: Fixed stop-loss and take-profit levels may fail in volatile markets. Adjust using ATR to align with market dynamics.
The Importance of Average True Range (ATR) in Trading
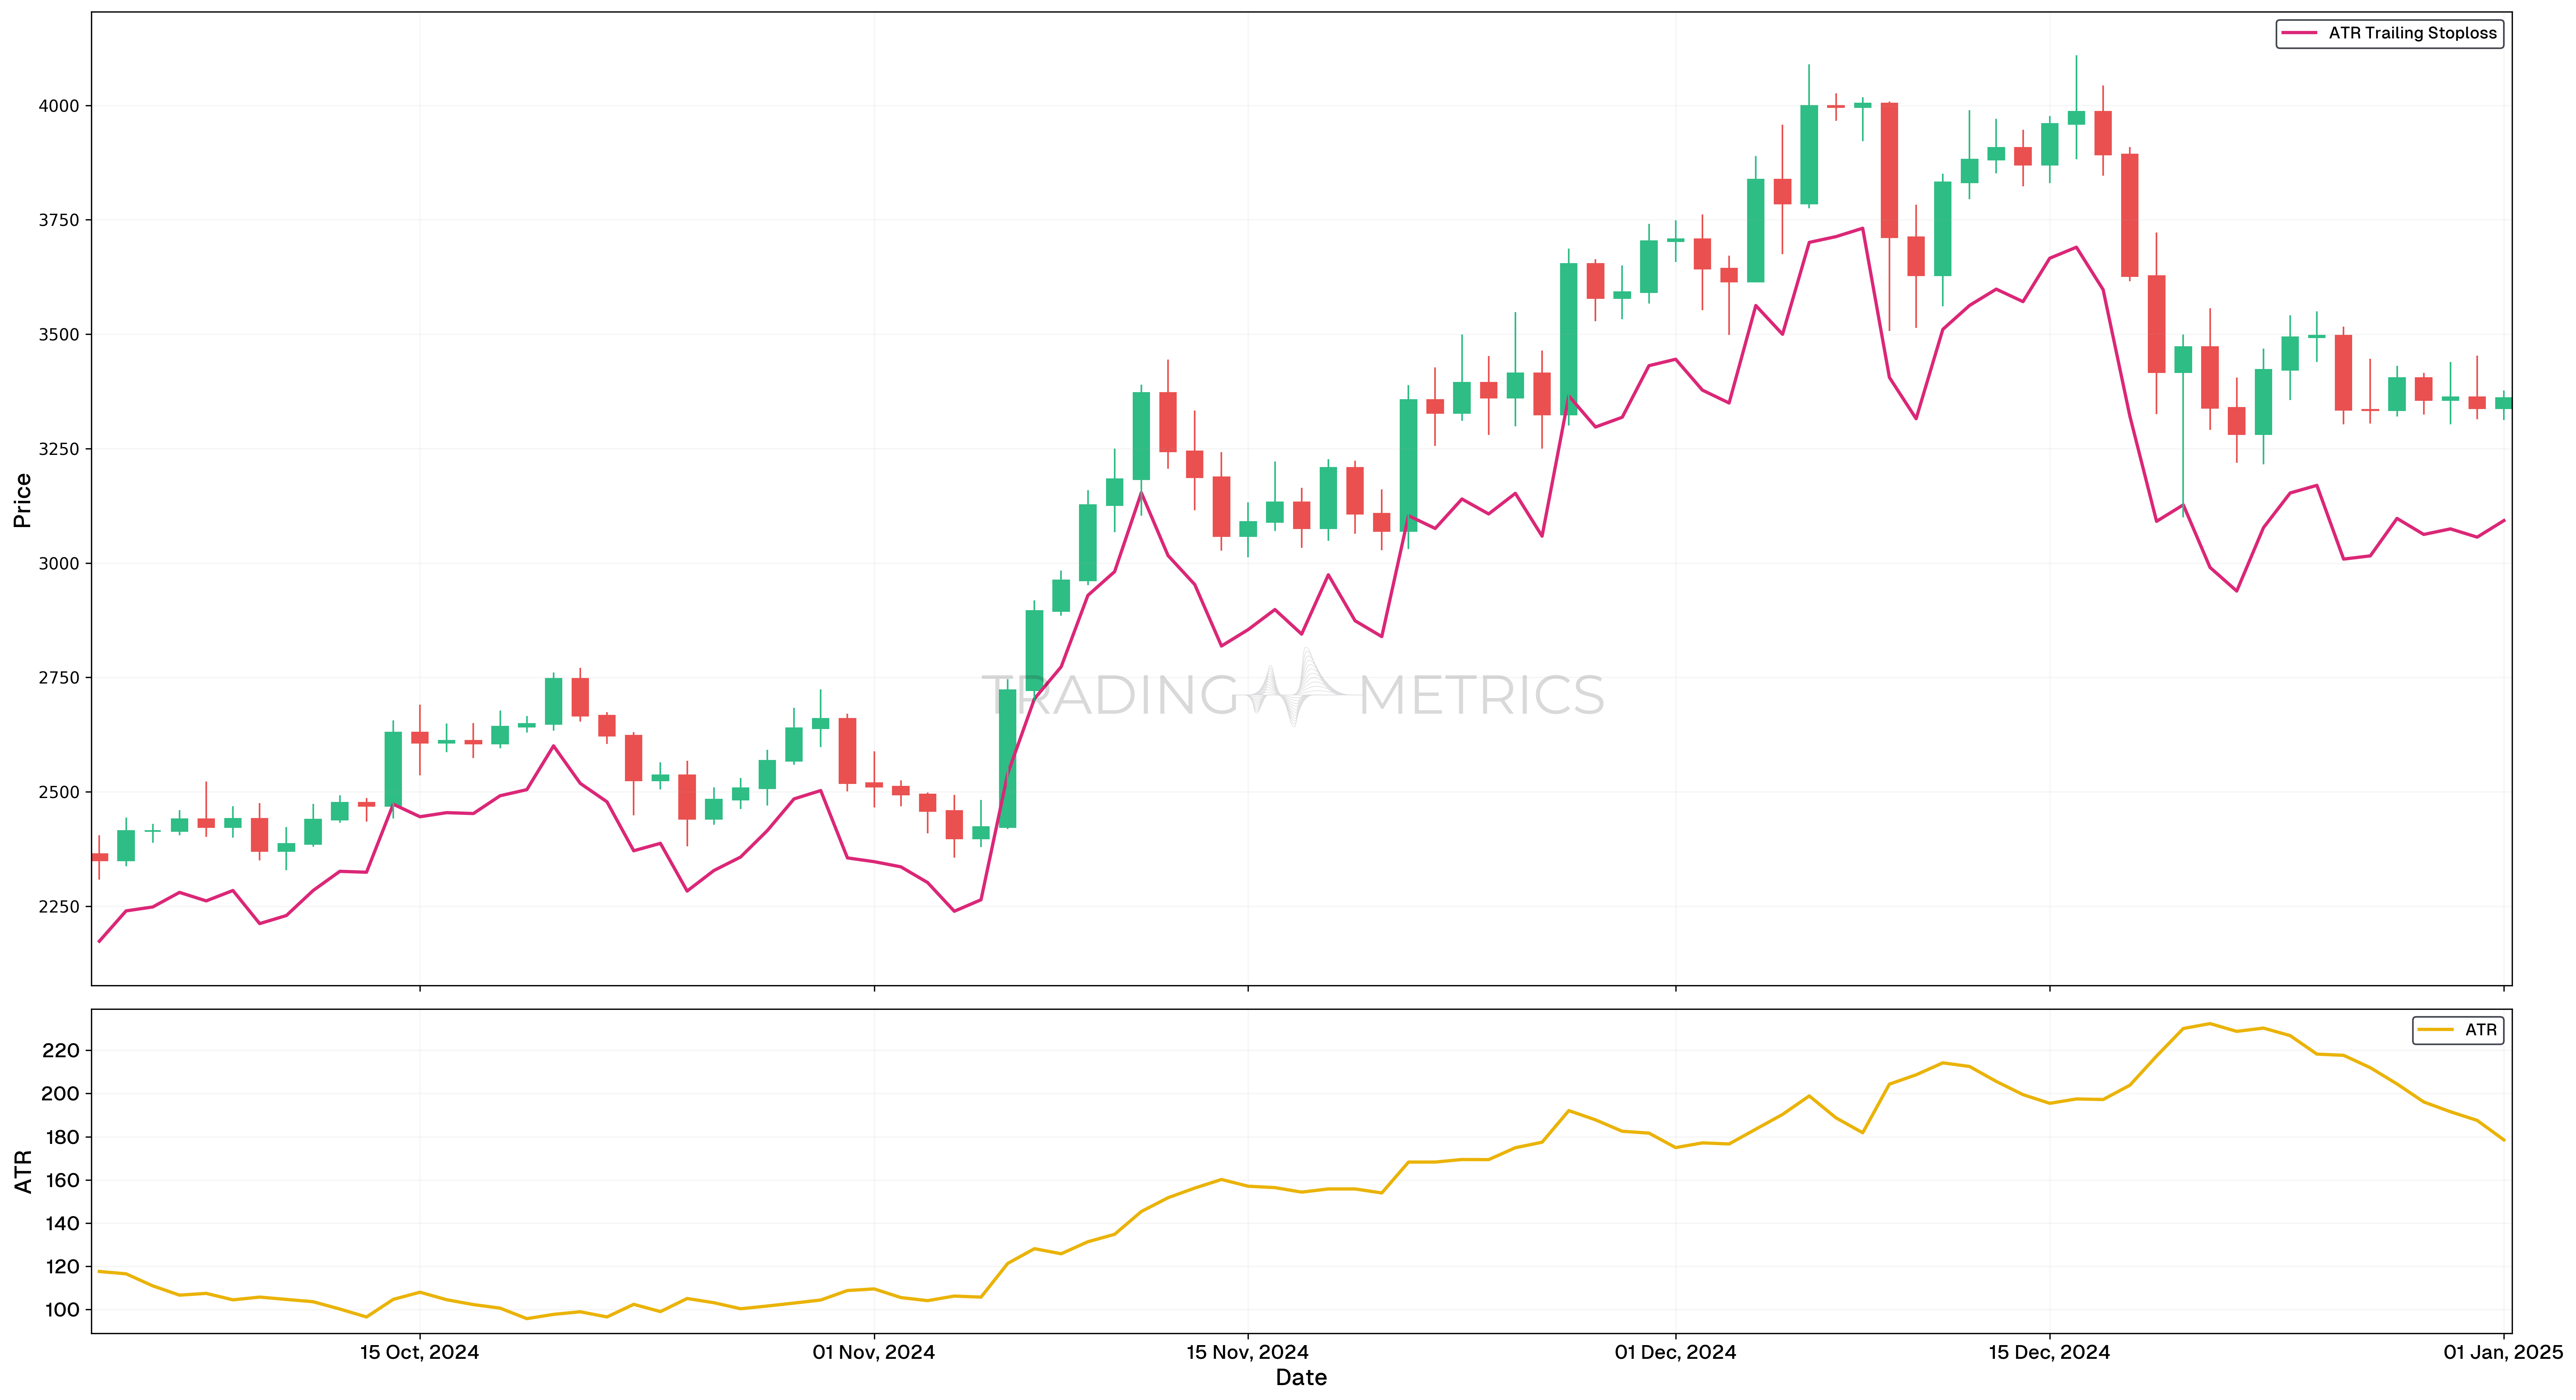
The Average True Range (ATR) is a important tool for measuring market volatility, providing traders with insights into potential price fluctuations and is also used as a Stoploss. It helps in setting stop-loss levels by accounting for market noise, ensuring trades are neither stopped out prematurely nor exposed to excessive risk. ATR is also valuable in identifying high-volatility and low-volatility periods, aiding in position sizing and strategy adjustments. By incorporating ATR into trading plans, traders can enhance risk management and align strategies with prevailing market conditions.
Beware of Sudden Spikes: ATR can spike due to sudden news. Be cautious and possibly avoid trading immediately after such events.
Unpacking ATR Periods: The Time Frames of Trading Volatility
Imagine you’re observing the waves at a beach. Sometimes they are calm, sometimes they are wild. How do you measure these waves over time? That’s where ATR periods come in. The Average True Range (ATR) periods refer to the specific timeframe over which the average volatility is calculated. Typically, traders use a 14-period ATR, but this can be adjusted based on their strategy and the asset being traded.
7-Period ATR
Imagine you’re trading a fast-moving cryptocurrency like Ethereum. A 7-period ATR will quickly reflect changes in volatility, helping you adapt to the market’s rapid movements. This could be useful for day traders looking to capture quick profits.
14-Period ATR
Let’s take BNB cryptocurrency. A 14-period ATR gives a balanced view, capturing the average volatility over about two weeks of trading. This period works well for swing traders who hold positions for several days to weeks.
50-Period ATR
Lets see how it looks when investing in litecoin. A 50-period ATR smooths out short-term fluctuations, providing a clearer picture of the crypto’s long-term volatility. This is helpful for investors focusing on long-term trends and stability.
Risk Assessment: A sudden spike in ATR can warn of impending market turbulence - trade cautiously in such conditions.
ATR as a Stoploss
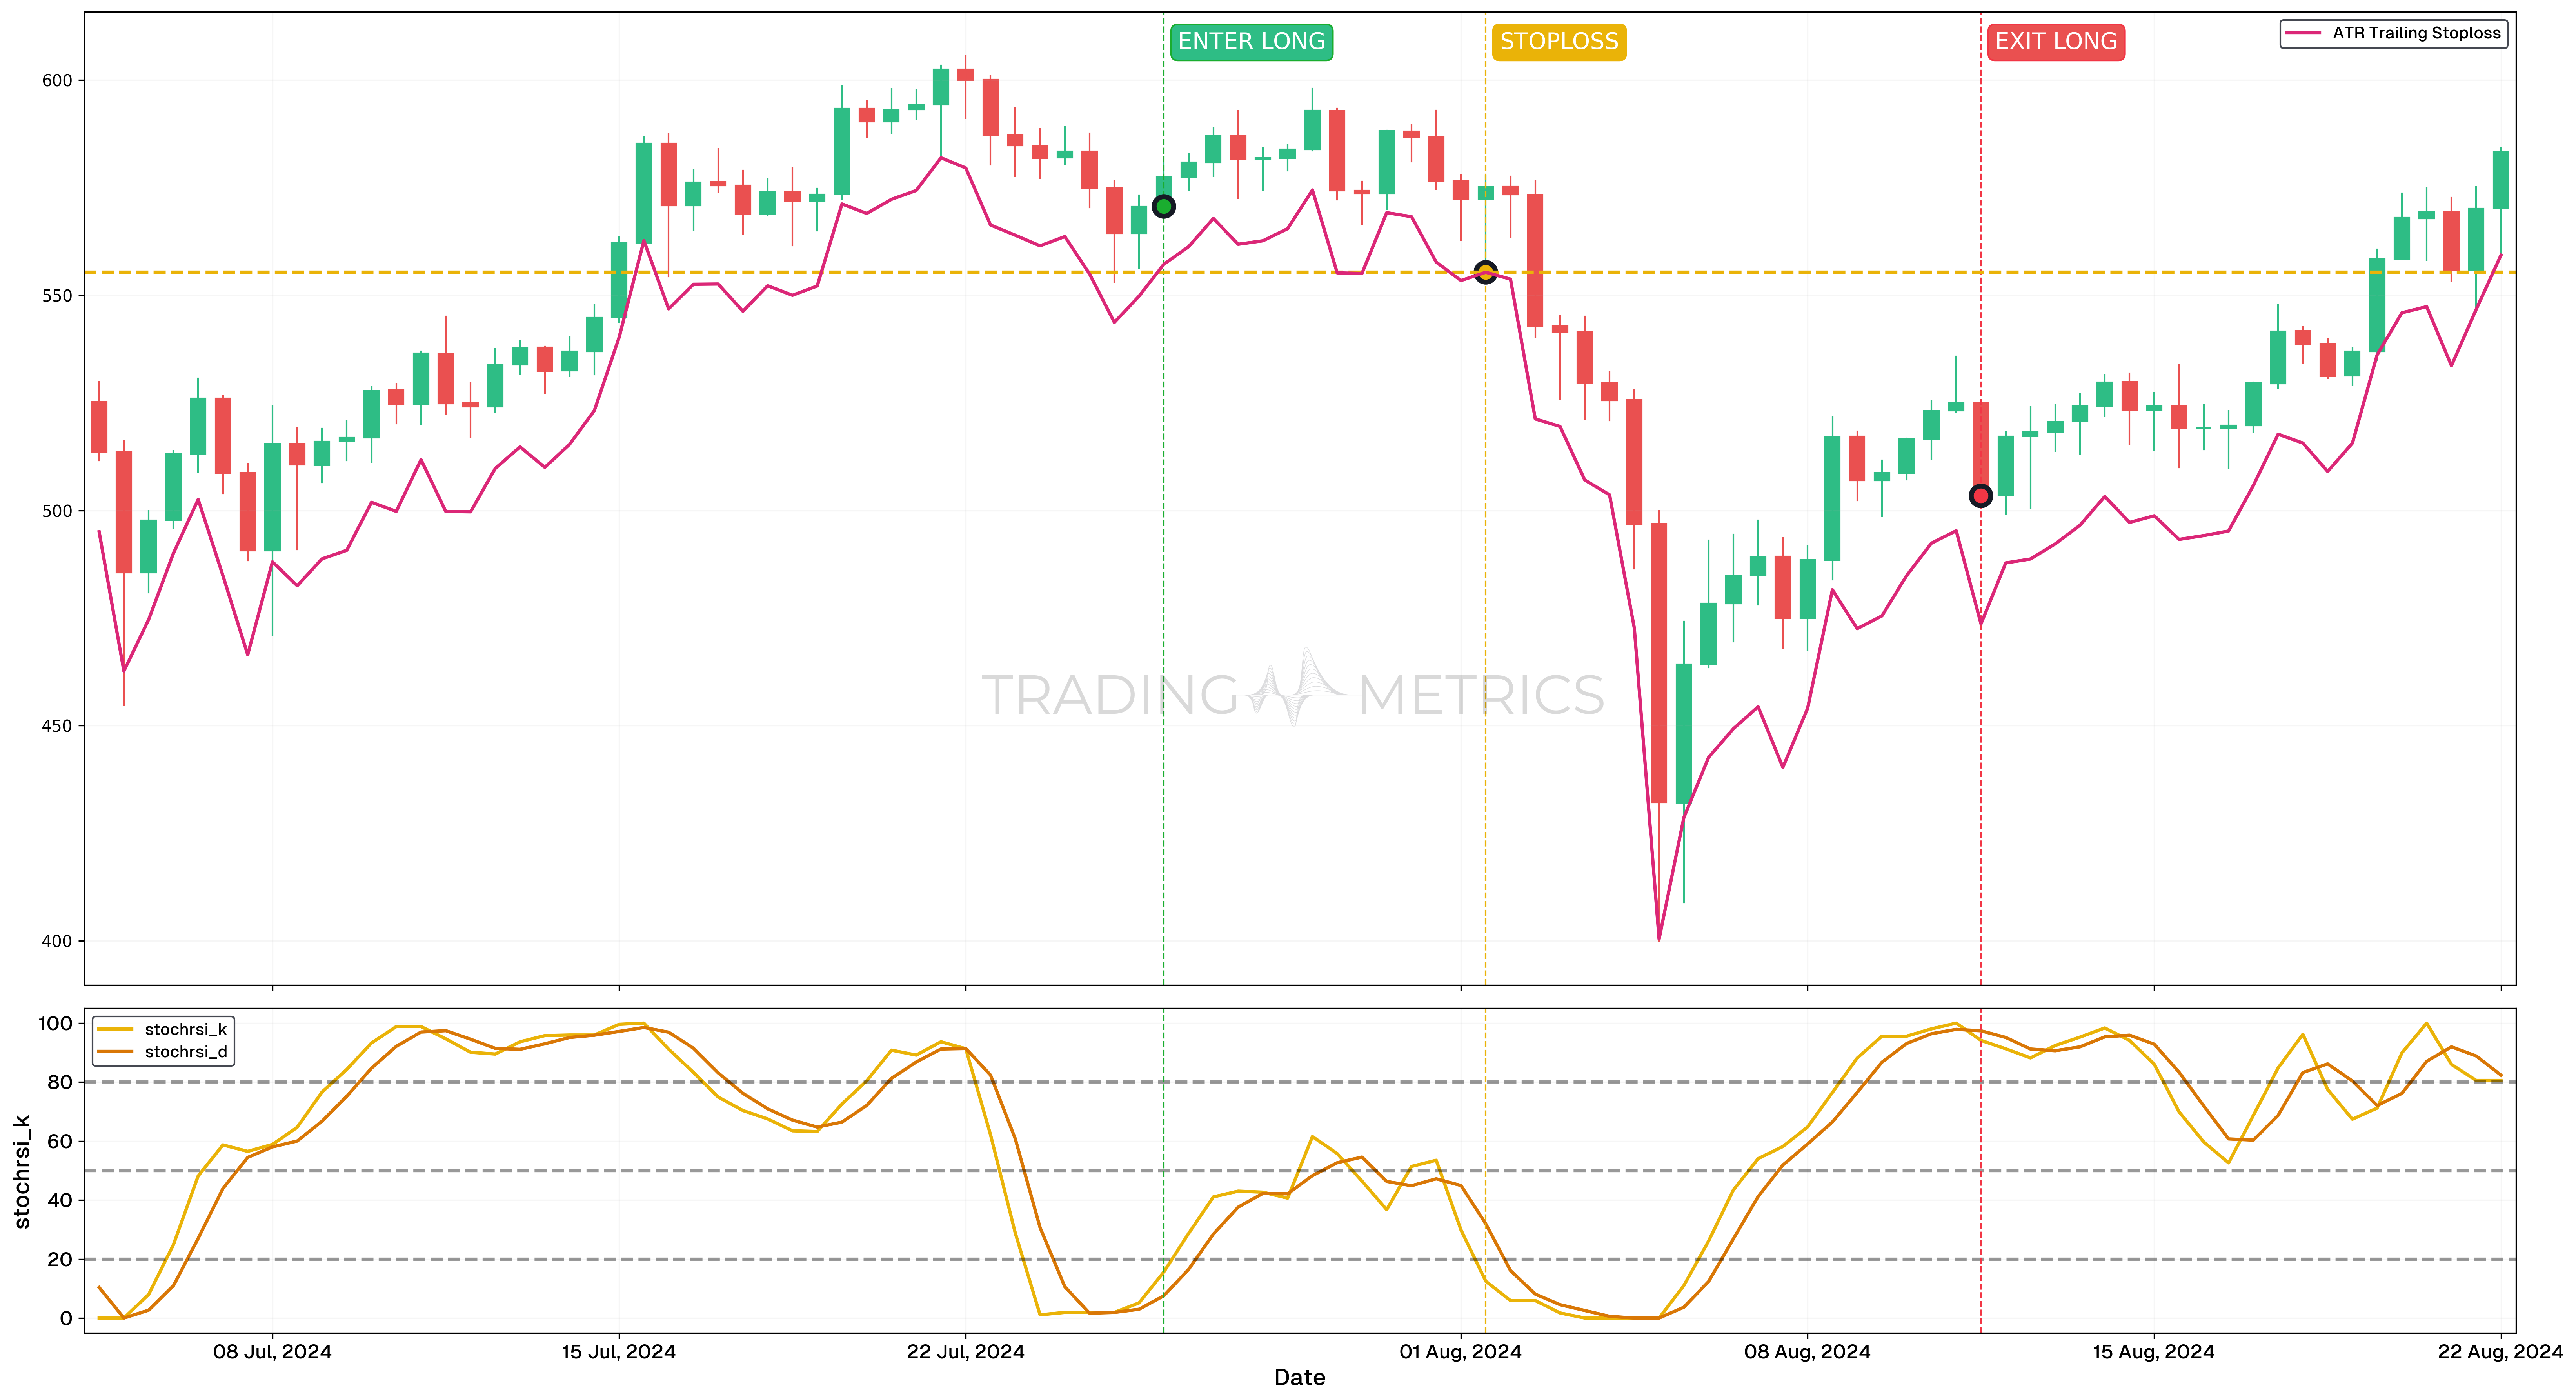
In this section, we will analyze the signals generated by the StochRSI and how the ATR-based stop-loss helped mitigate losses. Specifically, we will focus on the false signal generated on August 11, 2024.
Analysis
- The ATR-based stop-loss system demonstrated its effectiveness in mitigating potential losses during this trade.
- Initially, following trade signals without an ATR stop-loss would have resulted in a significant loss of -11.78%.
- By implementing the ATR as a stop-loss mechanism, the actual loss was reduced to -2.96%, representing a substantial 75% reduction in potential losses.
- The buy signal was triggered on July 26, 2024, 00:00, and the sell signal was anticipated for August 11, 2024, 12:00.
- However, the ATR stop-loss prompted an earlier exit on August 1, 2024, 12:00, effectively limiting the Drawdown.
Trade Setup
- Entry: A buy signal was triggered on July 26, 2024, 00:00, based on the trading system’s indicators. The trade was initiated with the ATR stop-loss system in place to manage risk.
- Exit: Instead of waiting for the sell signal on August 11, 2024, 12:00, the ATR stop-loss exited the position earlier on August 1, 2024, 12:00. This proactive exit significantly reduced the loss.
- Outcome: The trade ended with a loss of -2.96%, instead of the projected -11.78% without the stop-loss. This demonstrates the value of incorporating ATR-based risk management into a trading strategy, reducing potential losses by 75%.
Risk Management
- Stop-Loss Placement: The ATR-based stop-loss was triggered on August 1, 2024, 12:00, effectively mitigating a potentially larger loss and limiting the Drawdown to -2.96% instead of the projected -11.78% without the stop-loss.
- Position sizing: Position size was calculated to ensure a maximum risk exposure of 2% of trading capital, adhering to disciplined risk management principles.
- Risk-Reward Analysis: The proactive ATR stop-loss adjustment allowed for a significantly reduced loss, emphasizing the importance of dynamic risk management during volatile periods.
- Managing Volatility: Given the volatility indicated by the ATR, the stop-loss was actively monitored and adjusted to secure capital while preventing excessive drawdowns, demonstrating effective risk mitigation.
- Exit Strategy: The ATR stop-loss acted as a safety mechanism, exiting the position earlier than the intended sell signal, preventing further losses and emphasizing the importance of reactive risk management in volatile market conditions.
Combining ATR with Other Tools
ATR shines brightest when used alongside other indicators. Combine it with:
- Moving Averages: Identify trends and filter out noise.
- Bollinger Bands: Understand price deviation and identify potential breakouts.
- Relative Strength Index (RSI): Gauge momentum and avoid false signals.
Indicator Pairing: Pair ATR with trend-following indicators like moving averages to fine-tune your entries and exits.
Key Points
- Volatility Indicator: Average True Range (ATR) measures market volatility by calculating the average of the true range values over a specific period.
- True Range Calculation: True range considers the largest value among the current high minus low, the absolute value of the current high minus the previous close, and the absolute value of the current low minus the previous close.
- No Direction Bias: ATR reflects the magnitude of price movements without indicating trend direction, making it useful for both bullish and bearish setups.
- Volatility Analysis: Rising ATR values signal increasing volatility, while falling values indicate a quieter market environment.
- Stop-Loss placement: Traders use ATR to set stop-loss distances based on recent volatility, helping avoid premature exits during normal price fluctuations.
- Position sizing: ATR can help determine position size by aligning trade risk with current market volatility.
- Breakout Confirmation: Sudden spikes in ATR can confirm breakouts from consolidation, supporting momentum-based strategies.
- Adaptable Settings: Adjust the ATR period (commonly 14) to capture short-term or long-term volatility depending on trading style.
- Effective Across Assets: Works in stocks, forex, commodities, and crypto to assess volatility in various market conditions.
- Combine with Price Action and Indicators: Use alongside price patterns, support/resistance, or indicators like EMA and MACD for enhanced trade decisions.
Conclusion
Using ATR, traders gain a clearer picture of market volatility, helping them make more informed decisions. It helps in setting realistic stop-loss levels, sizing positions, and understanding market dynamics. The ATR is a versatile tool that, when used correctly, can significantly enhance your trading strategy. By understanding and harnessing the power of ATR, you can better navigate the turbulent waters of trading, making informed decisions that align with the market’s volatility. Whether you’re trading stocks like Tesla or cryptos like Bitcoin, ATR is your trusty companion in the quest for trading success.
Frequently Asked Questions
Quick answers based on this page's topic.
The ATR calculates the average price range over a set period, accounting for gaps between trading sessions. Unlike trend indicators, it provides a pure numerical value of how much an asset moves, helping traders anticipate potential price swings without predicting direction.
Using ATR for stop-losses ensures your exit is based on current market noise rather than a static number. By placing a stop beyond normal fluctuations—typically 1.5x to 2x the ATR—you give the trade room to breathe while protecting against actual reversals.
Yes, ATR is a cornerstone of volatility-based sizing. In high-volatility environments (high ATR), you should reduce position size to maintain consistent dollar risk; in low-volatility periods, you can safely increase size because the required stop-loss distance is smaller.