Bearish Harami Pattern: Reading Stalled Bullish Momentum
The Bearish Harami pattern is a subtle bearish reversal signal in technical analysis, most commonly appearing near the top of an uptrend. Think of it as a soft brake tap – a large bullish candle followed by a smaller candle (bearish or neutral) fully contained within the first candle’s body – hinting that buying pressure is fading and a pullback may follow.
When this pattern forms, it suggests bullish momentum is waning, offering traders a chance to consider shorts or taking profits as a potential downtrend begins.
How to Identify the Bearish Harami Pattern in Trading
The Bearish Harami is a bearish reversal candlestick formation. It develops over two candles near the end of an uptrend, with a smaller candle contained inside the body of the prior large bullish candle. The setup signals weakening buyers and potential downside reversal. Here’s how to spot it:
Start with the Big Picture
This pattern appears after an uptrend. Buyers push higher on the first candle, but the smaller candle fully contained within the prior bullish candle’s body shows momentum is fading.
Trace the Two-Candle Sequence
The structure unfolds in two parts. Spotting the smaller inside candle within the prior bullish candle confirms the setup.
- First Candle: A strong bullish candle driving the trend higher.
- Second Candle: A smaller candle fully contained within the first candle’s body, showing hesitation and a possible shift.
Zero in on the Confirmation Level
The confirmation level is the low of the first candle. Price should close below this level to validate the reversal.
Watch the Breakout
The bearish trigger comes when a subsequent candle closes below the first candle’s low.
- A decisive close below support or
- A large bearish follow-through candle
Both confirm the reversal and provide the entry.
Check Volume for Additional Confirmation
Volume behavior reinforces the signal.
- High or rising volume on the first bullish candle as buyers dominate.
- Lighter volume on the second candle showing hesitation.
- A surge in volume on the breakdown, confirming sellers stepping in.
Drop Clue: Measure the height of the first candle or use nearby support levels to project a realistic downside target from the confirmation close.
How to Trade the Bearish Harami Pattern (Trading Example)
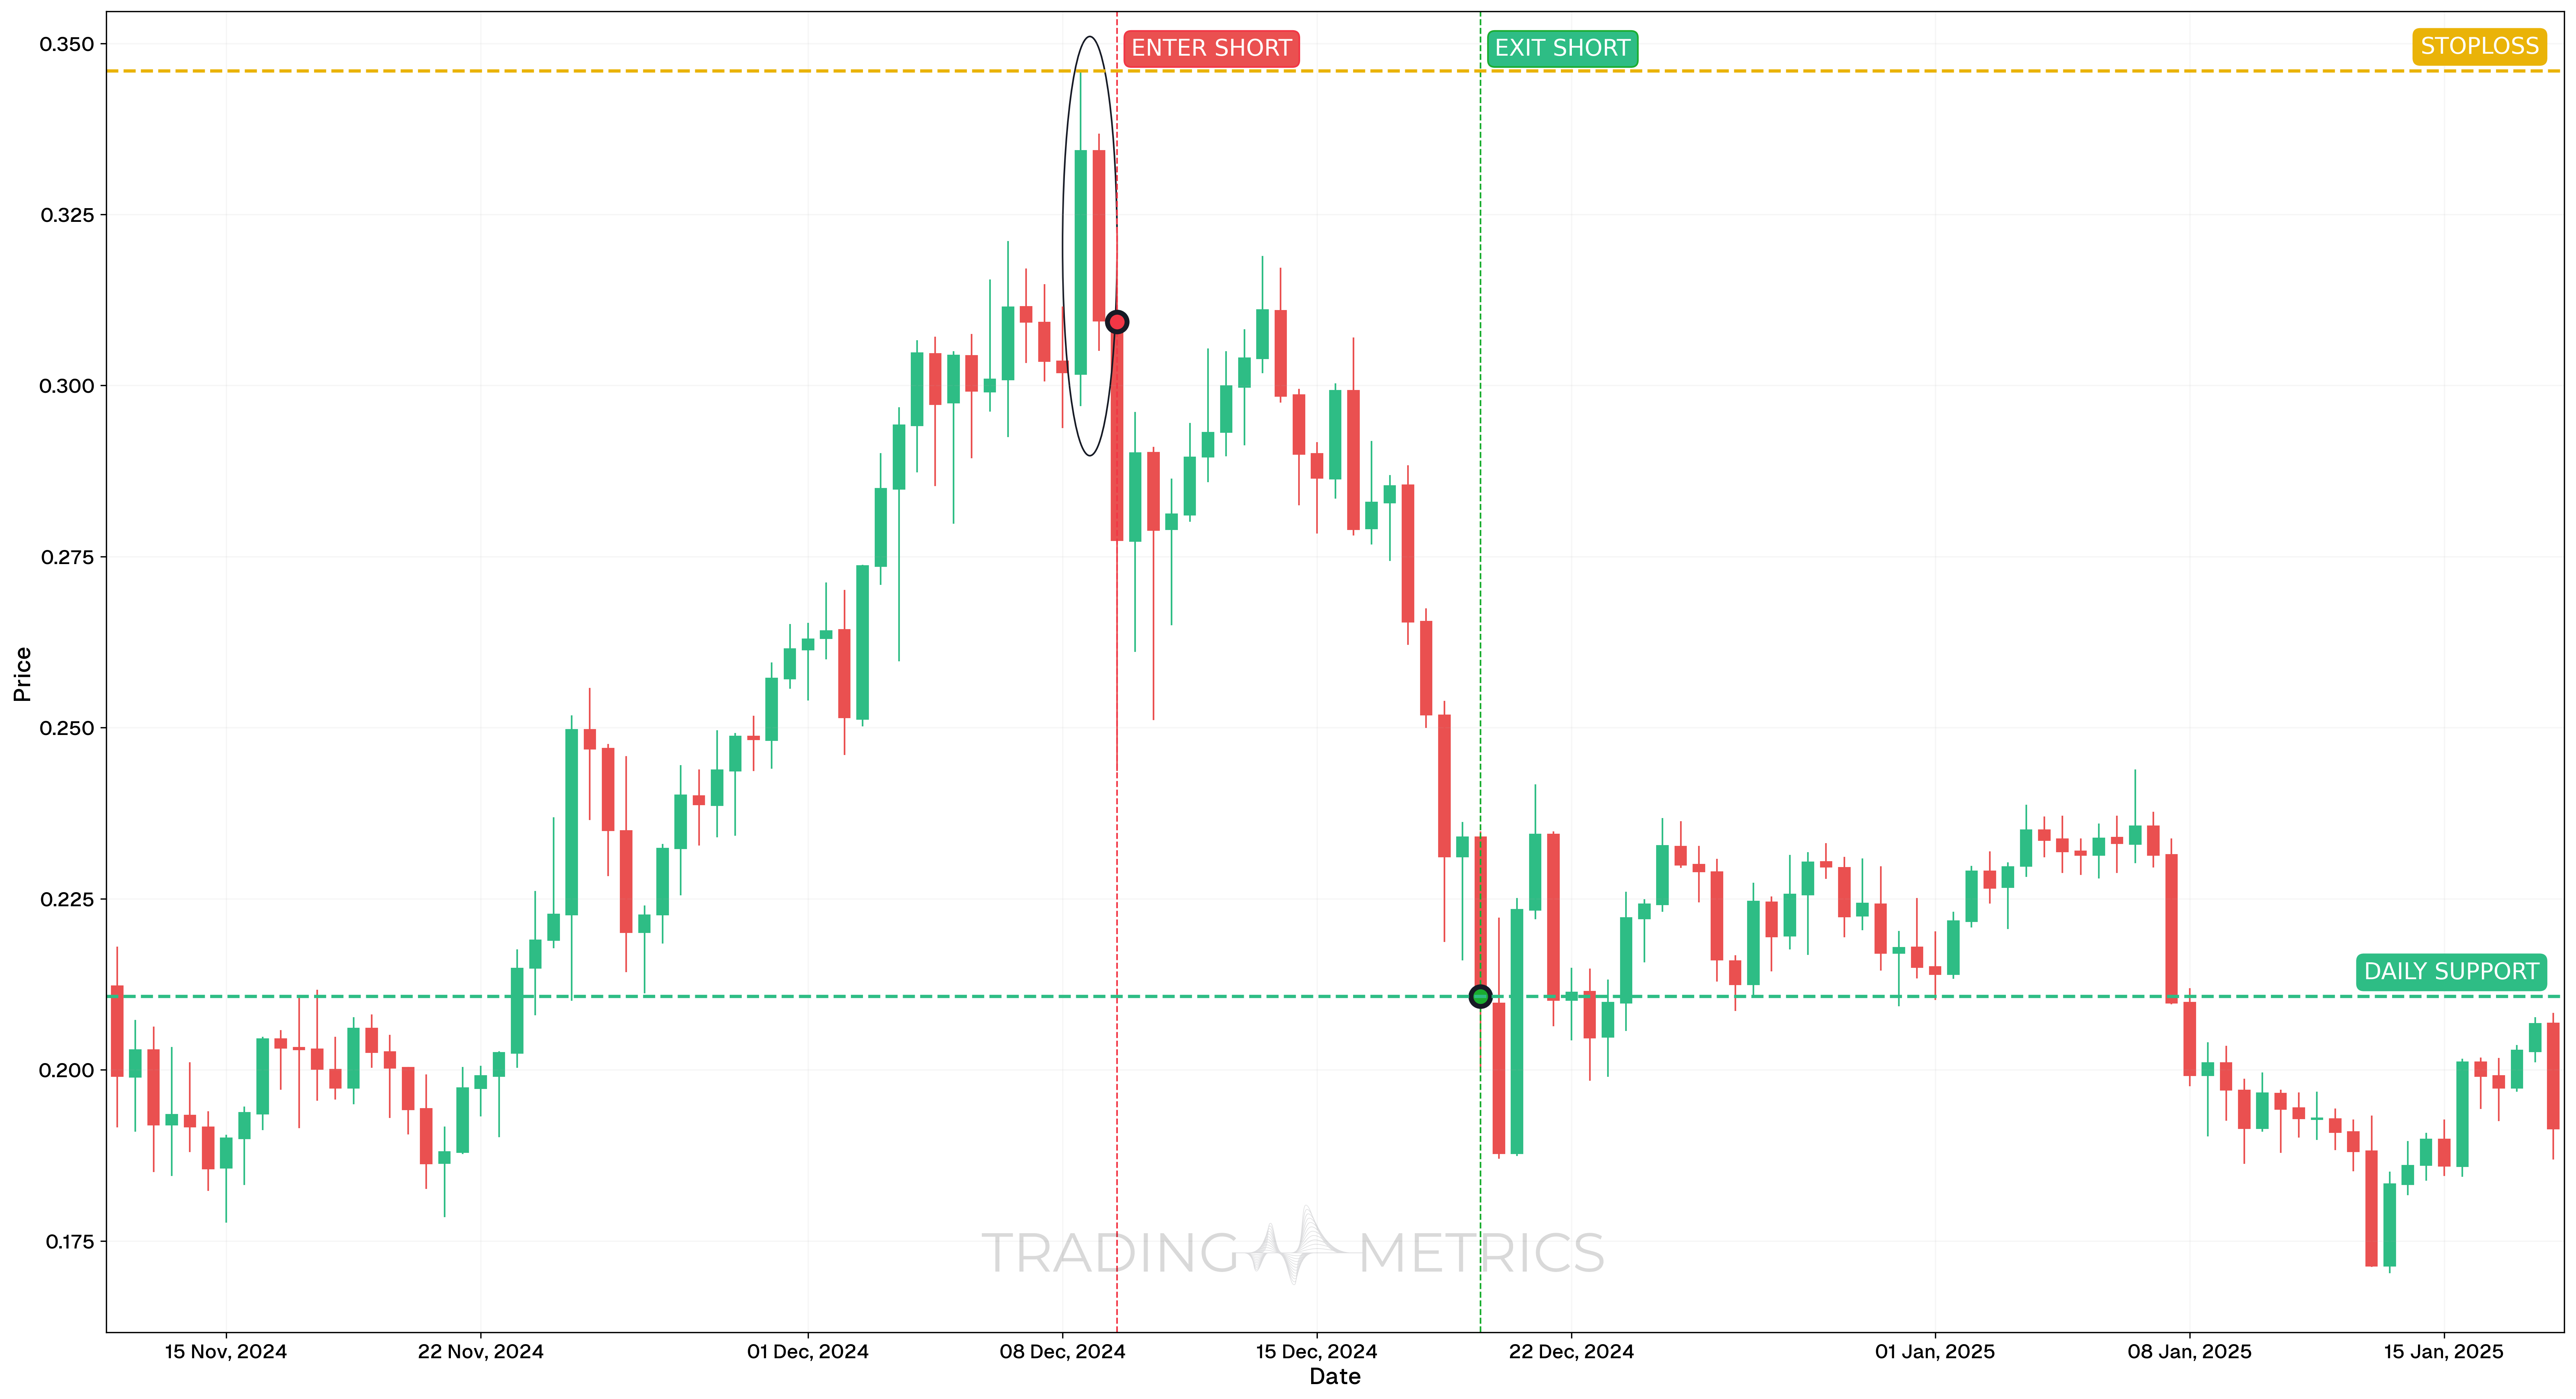
To illustrate how the Bearish Harami pattern can be used to enter a trade, we will choose the LOKAUSDT PERP pair on the 12-hour chart. This pattern signaled a potential trend reversal after an extended bullish phase and was supported by strong momentum divergence.
Analysis
Between November 12, 2024, and December 9, 2024, LOKAUSDT PERP rose aggressively before printing a clean Bearish Harami on December 9. The smaller candle opened and closed within the body of the previous bullish candle, indicating a slowdown in buying pressure. Momentum had already started to shift prior to the signal.
Trade Setup
-
Entry: The short was entered on December 9, 2024, at $0.3093, immediately after the Bearish Harami confirmation. Several confluences supported the entry:
-
Exit: The trade was closed on December 19, 2024, at $0.2107, near a prior support zone, just before price attempted a small consolidation.
-
Outcome: The Bearish Harami setup played out cleanly with a 31.8% drop, supported by weakening momentum and structure. Exit timing aligned with horizontal structure and allowed gains to be captured before rebound risk.
Risk Management
- Stop-Loss placement: The stop-loss was placed at $0.3459, just above the prior swing high / first candle’s high. This ensured the trade would be invalidated if buyers regained control above that level.
- Position sizing: Trade size was based on a 2% capital risk model, calculated using the distance between entry and stop-loss.
- Volatility Consideration: Moderate volatility accompanied the reversal, and the entry came after expansion began, reducing the risk of premature positioning.
- Risk-Reward Ratio: This setup offered a solid Risk-Reward Ratio of 1:2.69, balancing conservative stop placement with a meaningful downside target.
- Adaptive Exit Strategy: In similar setups, traders may scale out at key support levels or trail stops above recent lower highs to adapt to fast-moving markets.
Volume Ripple: A volume spike on the confirming candle reinforces a bearish turn.
Pre-Trade Checklist
Seal the Proof: Pair the pattern with volume spikes and indicators like RSI to filter fakes and boost your odds.
Key Points
- Candle Contrast: A large bullish candle with a small inside candle boosts reliability — similar sizes dilute it.
- Time Frame: Works best on daily or weekly charts after uptrends.
- Combine with Indicators: Use moving averages or RSI to confirm the reversal.
- Breakdown Confirmation: A close below the first candle’s low sets the turn — don’t trade the bearish harami alone.
- Price Target: Measure the first candle height or use support levels to set a downside target from confirmation.
- Risk Management: Set a stop-loss above the first candle’s high to limit losses if it fails.
Wait for the Break: Acting before confirmation risks a trap — let the bearish turn firm up.
Conclusion
The Bearish Harami pattern is a trader’s subtle tool for catching bearish reversals. Its two-candle nudge, paired with volume, RSI, and moving averages, can precede meaningful pullbacks. Whether in crypto, stocks, or forex, this pattern sharpens your edge. Stay patient, manage your risk, and let the bearish harami confirm — that small hesitation can precede a downside move.
Frequently Asked Questions
Quick answers based on this page's topic.
A Bearish Harami features a small candle contained entirely within the body of a large preceding bullish candle. It signals a 'stall' in momentum; after a strong push higher, the market has entered a state of hesitation, indicating that the prevailing uptrend is losing its structural support.
They are opposites in structure. In an Engulfing pattern, the second candle is larger and aggressive. In a Harami, the second candle is smaller and defensive. The Harami is a subtle warning of exhaustion, suggesting that buyers have stopped pushing rather than being actively rejected.
Because the Harami is a 'stall' pattern, it requires confirmation. Traders typically wait for the price to break and close below the low of the first (large) candle in the pattern. This breakdown proves that the hesitation has officially turned into a bearish trend shift.