Rising Wedge Pattern: A Slow-Climb Setup That Breaks Down
The Rising Wedge pattern is a sneaky bearish reversal signal in technical analysis, often lurking within an uptrend. Imagine it as a narrowing climb - price squeezing between converging trendlines - before snapping downward. When this pattern appears, it’s a crafty hint that bullish momentum is tapering off, priming traders to sell or short the asset as a downtrend approaches.
How to Identify the Rising Wedge Pattern in Trading
The Rising Wedge is a bearish reversal formation. It develops when price climbs inside a narrowing channel, with higher highs and higher lows converging. The setup completes when price breaks below support. Here’s how to spot it:
Start with the Big Picture
This pattern forms during an uptrend. Buyers keep pushing higher, but the slowing pace and converging structure signal weakening momentum and a possible reversal.
Trace the Converging Trendlines
The wedge is shaped by two boundaries drawing closer together. Recognizing this tightening action is key to validating the pattern.
- Lower Trendline: Price makes higher lows, sloping upward.
- Upper Trendline: Price makes higher highs, but at a slower pace, converging toward the lower line.
- Wedge Formation: The channel compresses as the lines close in, showing fading strength.
Zero in on the Support Line
The support line is the lower boundary of the wedge. It marks where buyers have consistently stepped in. Once this line is challenged, the pattern nears completion.
Watch the Breakdown
The bearish trigger comes when price closes below support.
- A decisive break under the lower trendline or
- A strong bearish candle
Both confirm the wedge has resolved downward and trigger the entry.
Check Volume for Additional Confirmation
Volume often mirrors the price structure.
- Builds during the early uptrend.
- Declines as the wedge narrows.
- Spikes on the breakdown, confirming bearish conviction.
When that surge appears, the wedge’s reversal is validated.
Map the Drop: Measure the height of the wedge at its widest point and project it downward from the break for a reliable price target.
How to Trade the Rising Wedge Pattern (Trading Example)
To demonstrate how the Rising Wedge pattern can be used to identify bearish reversals, we will analyze a trade on BTCUSDT PERP from the 12-hour chart. The pattern formed during a slowing uptrend and ultimately broke down with high momentum.
Analysis
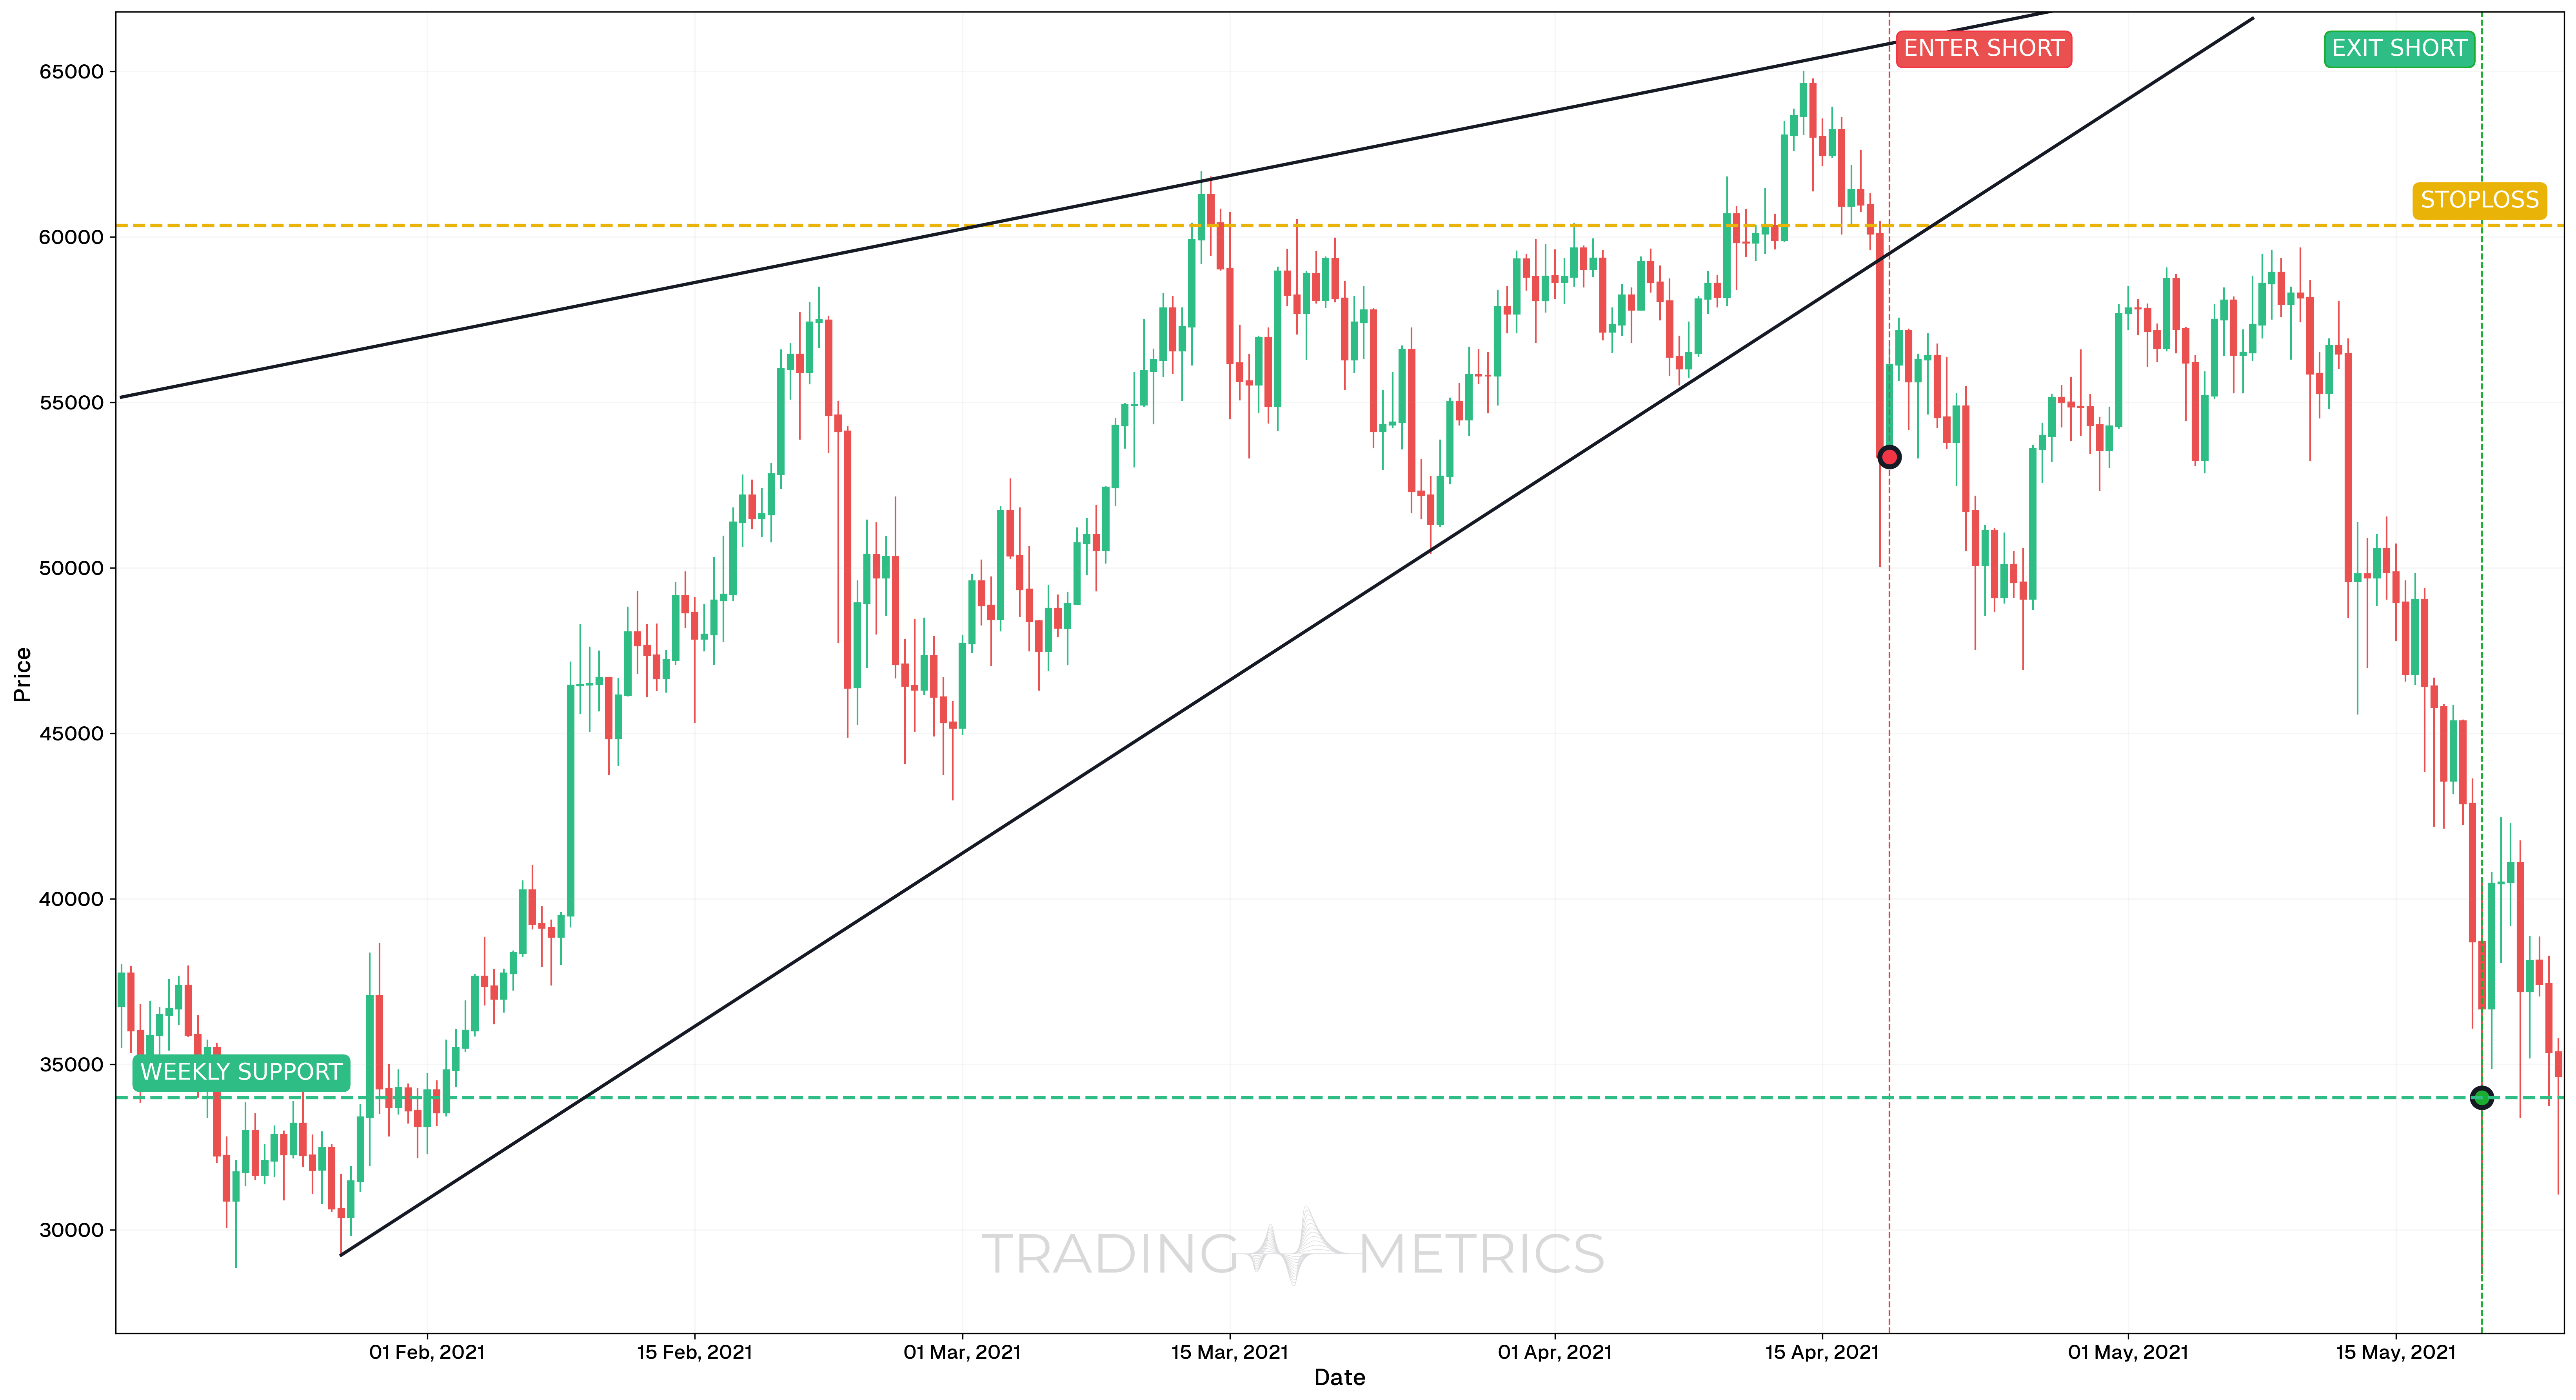
Between January 16 and May 23, 2021, BTCUSDT printed a textbook Rising Wedge on the 12h timeframe. Price formed a series of rising highs and lows within converging trendlines, suggesting a weakening uptrend. The pattern broke down decisively in mid may.
Trade Setup
-
Entry: Short position was entered on April 18, 2021, at $53,349.30, following a breakdown confirmation on the daily chart.
-
Exit: The trade was closed on May 19, 2021, at $34,000.90, near a prior daily support zone.
Risk Management
- Stop-Loss placement: Stop-loss was set at $60,348.70, just above the pattern’s upper boundary and recent swing high.
- Position sizing: Trade size was calculated using a 2% capital risk model based on entry and stop distance.
- Risk-Reward Ratio: 1:2.77 This means the potential reward (from entry to target) was 2.77 times greater than the potential loss (from entry to stop-loss). With a stop-loss at $60,348.70 and a take-profit at $34,000.90, the trade had a favorable reward profile. This setup offered a balanced approach to risk, making it suitable for trend reversal strategies where confirmation follows after pattern breakdown. A minimum 2:1 ratio is often preferred by traders to ensure long-term profitability even with modest Win rate.
- Volatility: Volatility compressed slightly during wedge formation and expanded heavily after breakdown.
- Multi-Timeframe Confirmation: The breakout was confirmed on the 1D timeframe, boosting trade confidence.
Volume Snap: A volume spike on the support break wedges the pattern into a bearish win.
Pre-Trade Checklist
Wedge It Tight: Pair the pattern with volume pops and indicators like RSI to cut fakes and boost your edge.
Key Points
- Line Convergence: The tighter the wedge, the stronger the signal - sloppy lines dilute it.
- Time Frame: Hits hardest on daily or weekly charts.
- Combine with Indicators: Use moving averages or RSI to nail the timing.
- Breakout Confirmation: The support break flips the switch - don’t jump early.
- Price Target: Measure the wedge’s widest height, project down from the break for your mark.
- Risk Management: Set a stop-loss above the peak to cap losses if it flops.
Hold the Line: Acting before the support break risks a wedge-shaped trap - wait for the snap.
Conclusion
The Rising Wedge pattern is a crafty tool for snagging bearish reversals. Its narrowing climb, paired with volume, RSI, and moving averages, can carve out big wins. Whether you’re trading crypto, stocks, or forex, this pattern sharpens your game. Stay patient, manage your risk, and let the wedge tighten - that squeeze could crack into a profitable drop.
Frequently Asked Questions
Quick answers based on this page's topic.
The narrowing range indicates 'buying exhaustion.' Even though prices are rising, the distance between highs and lows is shrinking, showing that buyers are struggling to maintain momentum. This pressure cooker effect usually results in a sharp breakdown to the downside.
An Ascending Triangle has a flat resistance ceiling, which is bullish. A Rising Wedge has two upward-sloping lines that converge. Because the buyers are being forced into a tighter and tighter corner at higher prices, it is almost always a bearish reversal signal.
To find the target, measure the vertical distance between the two trendlines at the widest point of the wedge (its start). Project that distance downward from the support break for your objective 1:1 mathematical goal.