Gravestone Doji Pattern: A Long Wick That Marks Exhaustion
The Gravestone Doji pattern is a somber bearish reversal signal in technical analysis, often appearing at the peak of an uptrend. Picture it as a tombstone - a candlestick with a long upper shadow, little to no lower shadow, and an open and close near the low - marking the end of bullish hopes. When this pattern forms, it’s a stark warning that bullish momentum is fading, offering traders a chance to sell or short the asset as a downtrend looms overhead.
How to Identify the Gravestone Doji Pattern in Trading
The Gravestone Doji is a bearish reversal candlestick formation. It develops as a single candle at the peak of an uptrend, with a long upper shadow and a close near the open. The setup signals that buyers pushed higher but failed to hold, leaving sellers in control. Here’s how to spot it:
Start with the Big Picture
This pattern appears after an uptrend. Buyers drive the market higher during the session, but by the close, sellers erase the gains, showing exhaustion at the top.
Look for the Candlestick Shape
The Gravestone Doji has a very distinct form:
- A long upper shadow, showing buyers pushed the price far higher.
- A small or no real body, with the open and close nearly equal.
- Little to no lower shadow, with price finishing near the session low.
Zero in on the Confirmation Level
The confirmation level is the low of the Gravestone Doji. Price must close below this level to validate the reversal.
Watch the Breakdown
The bearish trigger comes when the next candle closes below the Gravestone Doji low.
- A decisive bearish candle after the Gravestone Doji confirms the failure.
- This breakdown provides the entry point.
Check Volume for Additional Confirmation
Volume behavior strengthens the pattern.
- Spikes during the Gravestone Doji, reflecting heavy buying pressure that fails.
- Rises again on the confirming bearish candle, showing sellers have taken over.
Drop Marker: Measure the upper shadow height or use nearby support levels to project a realistic price target downward from the confirmation close.
How to Trade the Gravestone Doji Pattern (Trading Example)
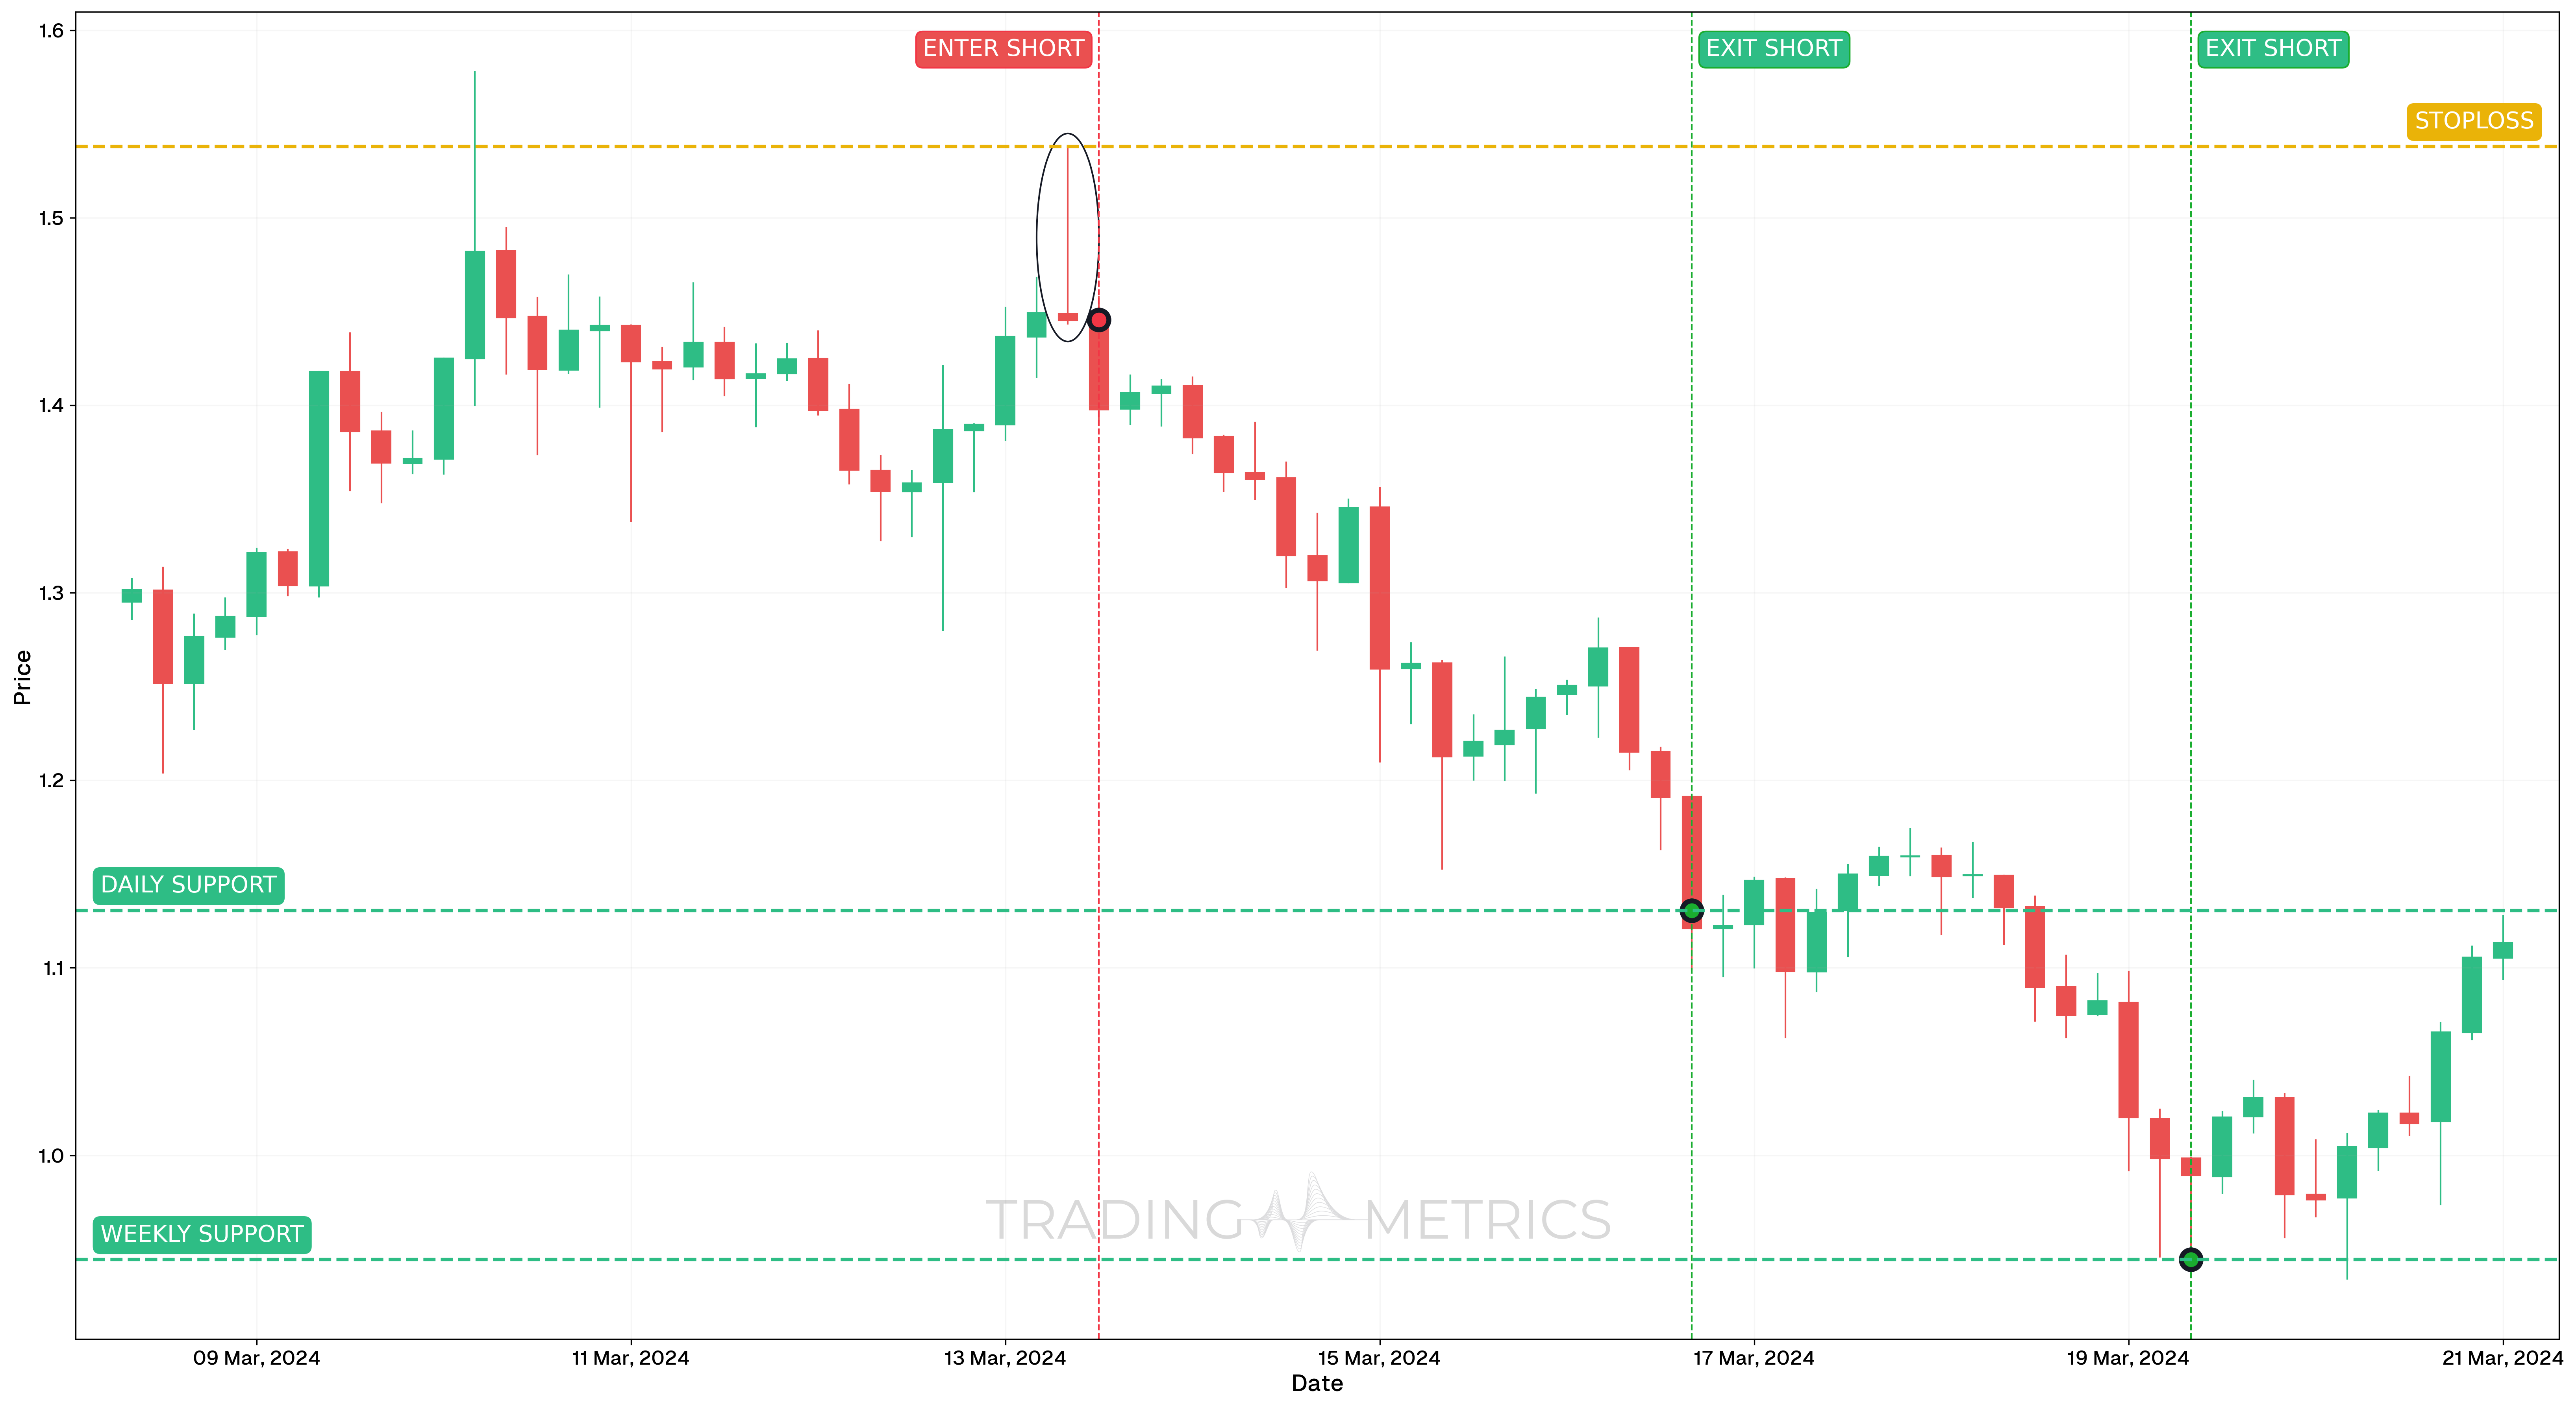
To illustrate how the Gravestone Doji pattern can be used to enter a trade, we will choose the MAGICUSDT pair. This bearish reversal setup developed on the 4-hour chart, offering a clean breakdown after a rejection at local highs.
Analysis
On March 13, 2024, MAGICUSDT formed a clear Gravestone Doji candle after a short-term bullish move. The long upper shadow showed strong rejection from higher prices, while the close near the candle’s low confirmed selling pressure. This pattern often marks a transition from demand to supply dominance.
Trade Setup
-
Entry: The short position was entered on March 13, 2024, at 12:00, at $1.538, after the price confirmed the breakdown below the Gravestone Doji low. Entry was supported by:
-
Exit: The trade had multiple exits, each aligned with major previous support/resistance zones. These levels had shown historical significance and were used to gradually scale out of the position as price moved lower.
-
Outcome: The Gravestone Doji reversal resulted in a well-structured move to the downside. By taking profits at multiple support zones, the trader preserved gains while following the shift in market sentiment.
Risk Management
- Stop-Loss placement: The stop-loss was positioned just above the upper wick of the Gravestone Doji, where pattern invalidation would occur if price broke back above the high.
- Position sizing: A 2% capital risk model was used, based on the difference between entry and stop-loss.
- Volatility Consideration: This pattern formed after a high Volatility move upward, followed by a swift rejection and tightening range. That sequence favored a well-timed bearish entry.
- Adaptive Exit Strategy: Beyond the fixed structure exits, traders could have used trailing stops above lower highs or short-term EMA-based exits to capture more downside.
Volume Tomb: A volume spike on the Gravestone Doji candlestick, followed by bearish follow-through, buries the pattern into a bearish turn.
Pre-Trade Checklist
Bury the Proof: Pair the pattern with volume spikes and indicators like RSI to dodge fakes and boost your odds.
Key Points
- Shadow Precision: A long upper shadow with a near-zero body boosts reliability - short shadows dilute it.
- Time Frame: Buries deepest on daily or weekly charts after uptrends.
- Combine with Indicators: Use moving averages or RSI to confirm the reversal.
- Breakout Confirmation: A close below the Gravestone Doji low sets the turn - don’t jump on the Gravestone Doji alone.
- Price Target: Measure the shadow height or use support levels for a target below the close.
- Risk Management: Set a stop-loss above the Gravestone Doji high to limit losses if it fails.
Wait for the Tomb: Acting before confirmation risks a Gravestone Doji trap - let the reversal sink in.
Conclusion
The Gravestone Doji pattern is a trader’s somber tool for catching bearish reversals. Its tombstone shape, paired with volume, RSI, and moving averages, can bury big gains. Whether in crypto, stocks, or forex, this pattern sharpens your edge. Stay vigilant, manage your risk, and let the Gravestone Doji mark the peak - that failed rally could sink into a winning trade.
Frequently Asked Questions
Quick answers based on this page's topic.
It represents a 'failed rally.' Buyers pushed the price significantly higher during the session, but by the close, sellers had driven it all the way back to the opening price. This 'tombstone' shape shows that any demand at higher levels was completely overwhelmed by supply.
The difference lies in the candle body. A Gravestone Doji has no real body (open and close are the same), signaling total indecision. A Shooting Star has a small real body near the bottom. Both are bearish rejections, but the Doji highlights a more fragile market state.
No. While very bearish, it is a single-candle signal that requires confirmation. Professional traders wait for the following candle to break and close below the Doji's low to confirm that the rejection has led to a sustained shift in momentum.