Matching High Pattern: When Two Highs Mark a Ceiling
The Matching High pattern is a concise bearish reversal signal in technical analysis, often appearing near the crest of an uptrend. It resembles a double-top moment, where two candles (often bullish, though the second can also turn bearish) close at nearly the same high, signaling that buyers failed to push higher.
This formation highlights stalling bullish momentum at resistance, hinting that demand is drying up. When it appears, the pattern suggests that control may begin shifting from buyers to sellers, offering traders a chance to sell or short as a potential downtrend develops.
How to Identify the Matching High Pattern in Trading
The Matching High is a bearish reversal candlestick formation. It develops over two candles at the peak of an uptrend, with both candles closing at nearly the same high. The setup signals that buyers failed to push past resistance, hinting at a potential reversal. Here’s how to spot it:
Start with the Big Picture
This pattern forms during an uptrend. The market rallies strongly, but when price closes at the same level twice, it shows a ceiling of resistance.
Trace the Two-Candle Sequence
The structure is made of two candles, with the second candle failing to extend the advance.
- First Candle: A bullish candle that extends the trend, often strong in size.
- Second Candle: A smaller-bodied candle (often bullish, but sometimes bearish) that closes at or very near the first candle’s high, signaling stalled momentum.
Zero in on the Confirmation Level
Confirmation Level is the low of the second candle. A close below this level (or below the first candle’s low for stricter confirmation) validates the bearish reversal.
Watch the Breakdown
The bearish trigger comes when a subsequent candle closes below the second candle’s low.
- A strong bearish confirmation candle provides the entry point.
Check Volume for Additional Confirmation
Volume behavior adds weight to the pattern.
- Often peaks on the first bullish candle as buyers push strongly.
- Dips or holds flat on the second candle, showing fading strength.
- Spikes on the confirming bearish candle, signaling sellers stepping in.
Drop Gauge: Measure the range from the matching high to the second candle’s low or use nearby support levels to project a realistic price target downward from the confirmation close.
How to Trade the Matching High Pattern (Trading Example)
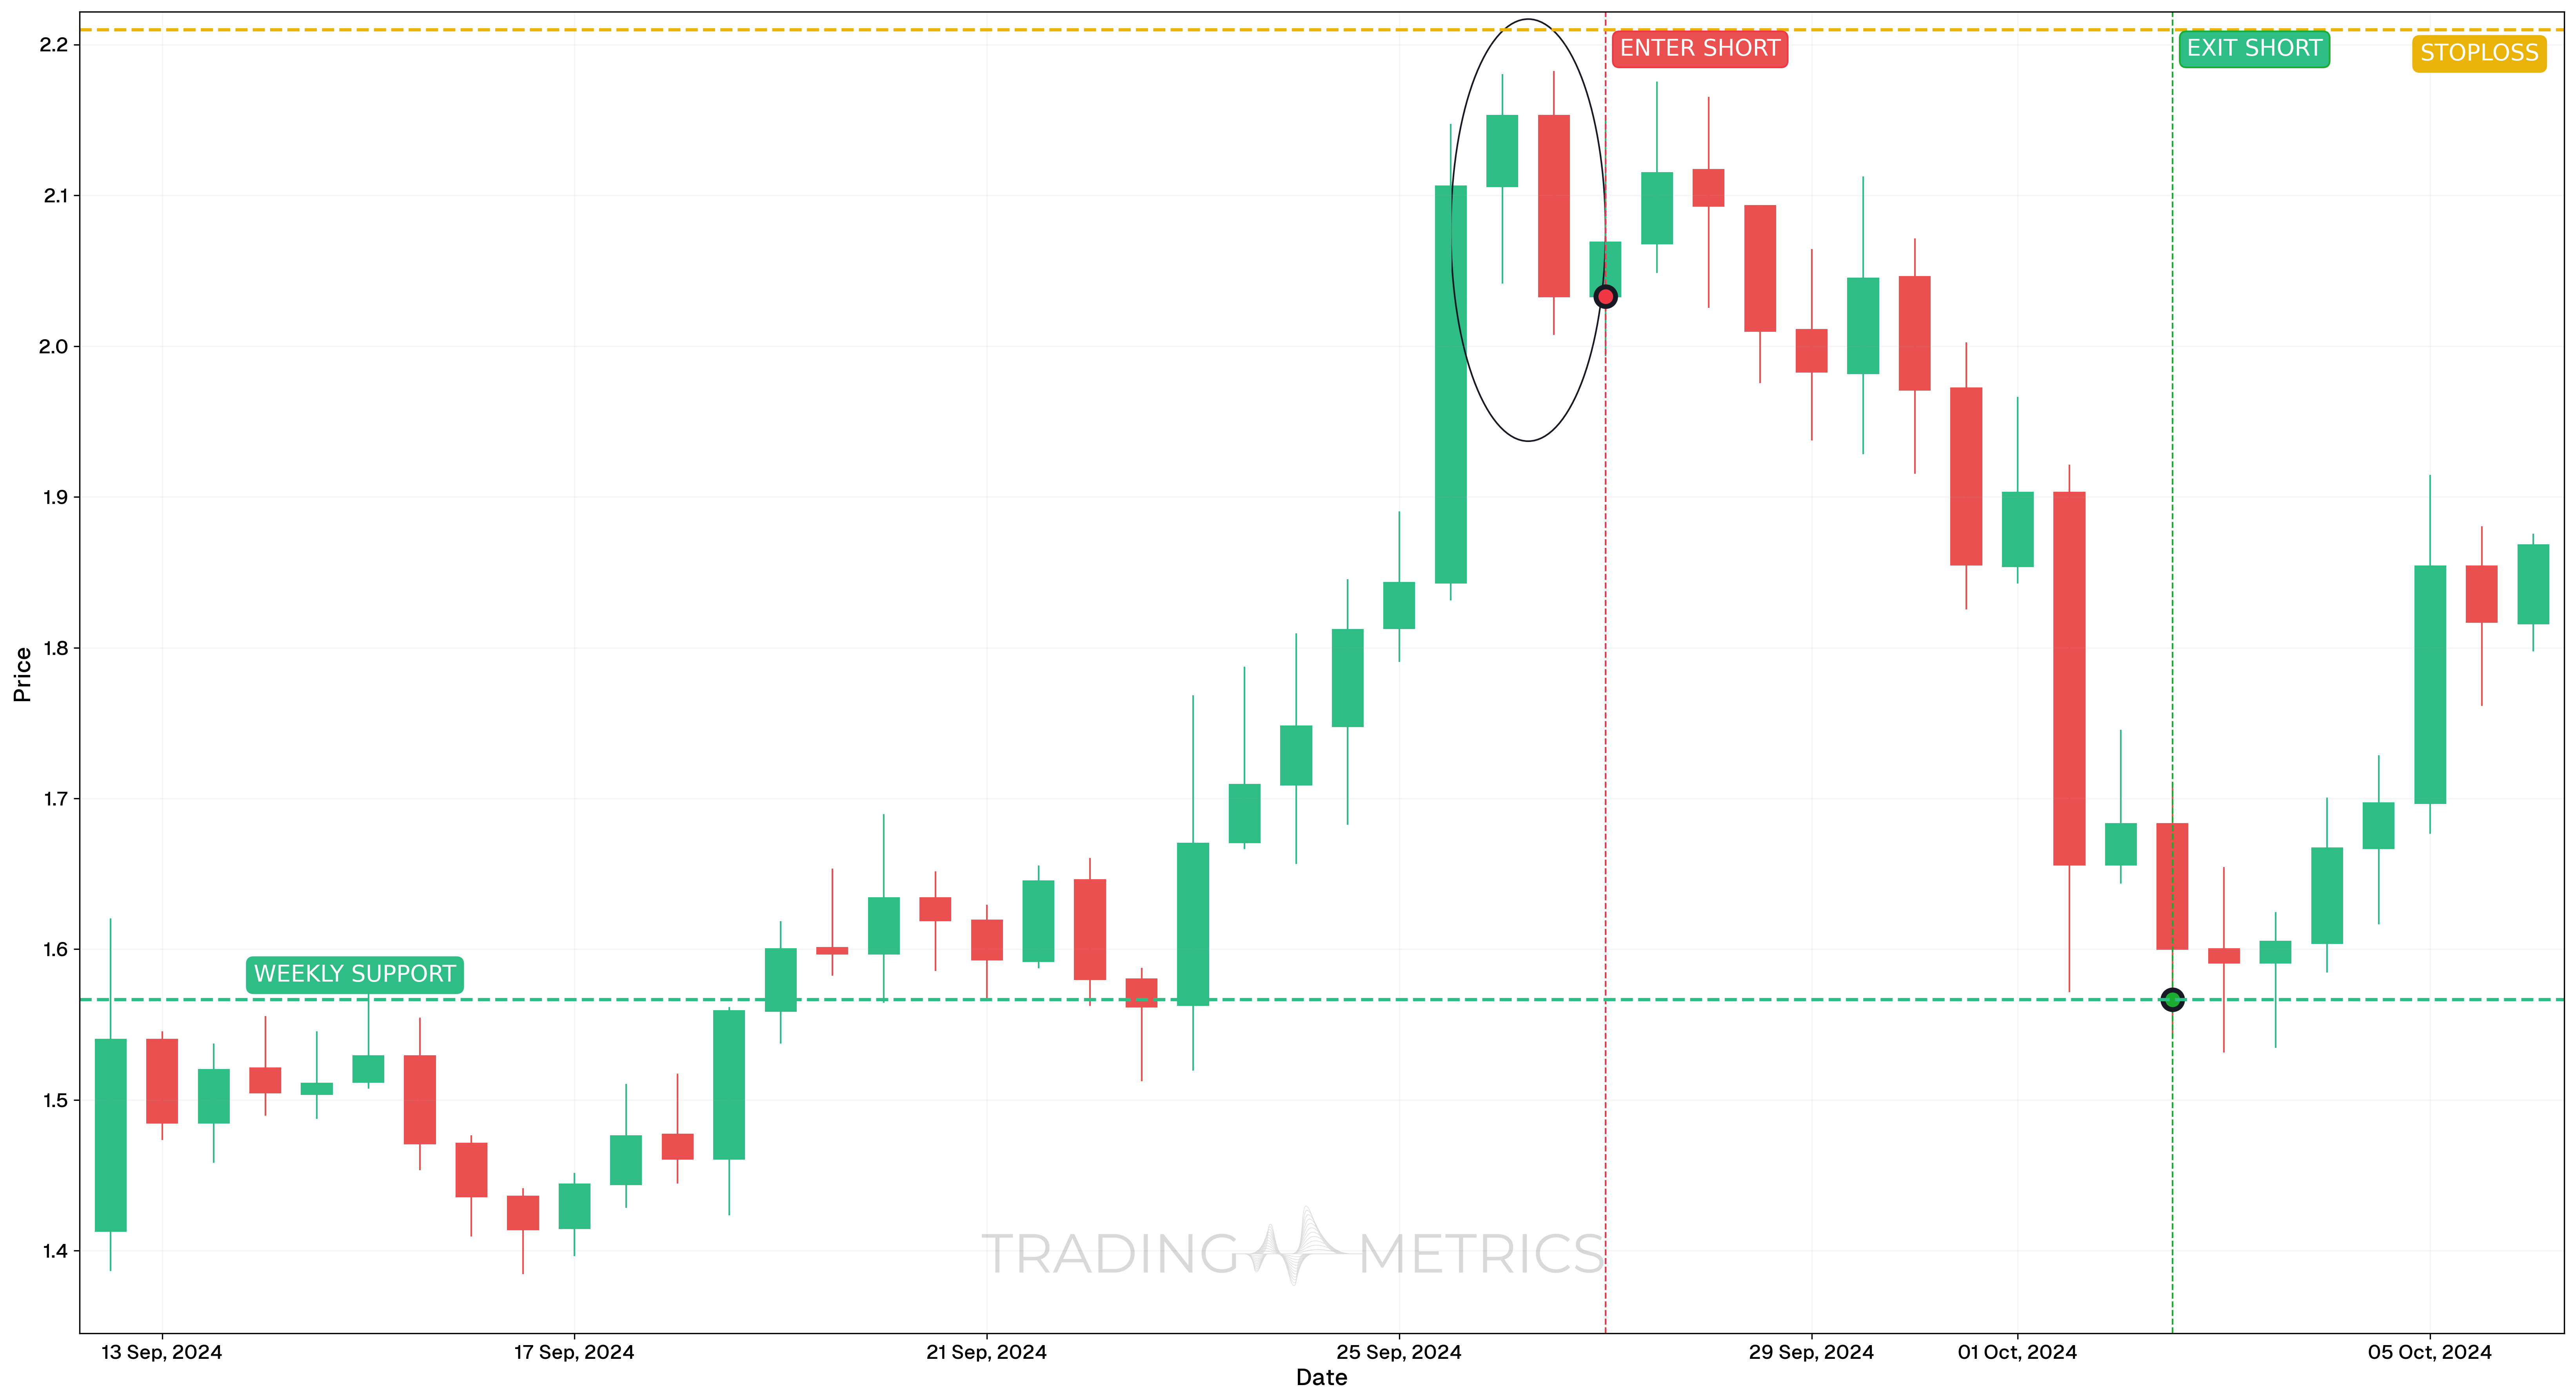
To demonstrate how the Matching High bearish candlestick pattern can signal a reversal, we’ll review a short trade on WLDUSDT using the 12-hour chart. This setup took place during a temporary top formation and showed signs of exhaustion near resistance.
Analysis
Between September 12 and October 6, 2024, WLDUSDT experienced a rising trend that culminated in a Matching High formation on September 27, 2024. This bearish reversal signal occurred after price hit a key resistance and failed to close higher, forming two near-equal highs. The lack of new high momentum, combined with other indicators, suggested potential downside.
Trade Setup
-
Entry: The trade was entered on September 27, 2024, at $2.0377, after the Matching High completed and a confirmation candle closed lower. Entry reasoning included:
- Clear pattern formation near local resistance
- StochRSI was in overbought territory, indicating short-term exhaustion
-
Exit: The trade was exited on October 2, 2024, at $1.5666, as price touched a key weekly support level and showed signs of stabilization.
-
Outcome: The pattern played out cleanly, with price rejecting the high twice and reversing downward. The exit at support secured a strong reward.
Risk Management
- Stop-Loss placement: The stop-loss was placed at $2.2099, just above the swing high that formed the Matching High.
- Position sizing: A 2% capital risk model was used, with size calculated based on the distance between entry and stop-loss.
- Volatility Consideration: Volatility contracted near resistance, then expanded sharply on breakdown, validating the reversal trade.
- Risk-Reward Ratio: 1:2.74 – indicating strong trade efficiency from a short-term candlestick setup.
Volume Match: A volume spike on the confirming candle seals the pattern into a bearish turn.
Pre-Trade Checklist
Match the Proof: Pair the pattern with volume spikes and indicators like RSI to dodge fakes and boost your odds.
Key Points
- High Alignment: Two closes at nearly the same high boost reliability - wide gaps dilute it.
- Time Frame: Hits hardest on daily or weekly charts after uptrends.
- Combine with Indicators: Use moving averages or RSI to confirm the reversal.
- Breakout Confirmation: A close below the second candle’s low sets the turn - don’t jump on the match alone.
- Price Target: Measure the range from high to low or use support levels for a target below the confirmation.
- Risk Management: Set a stop-loss above the matching high to limit losses if it fails.
Wait for the Match: Acting before confirmation risks a mismatched trap - let the reversal confirm.
Conclusion
The Matching High pattern is a trader’s crisp tool for catching bearish reversals. Its two-candle ceiling, paired with volume, RSI, and moving averages, can cap big gains. Whether in crypto, stocks, or forex, this pattern sharpens your edge. Stay patient, manage your risk, and let the highs match - that stalled peak could drop into a winning trade.
Frequently Asked Questions
Quick answers based on this page's topic.
A Matching High consists of two candles with nearly identical closing prices at the top of a trend. It indicates that the market has hit a 'hard ceiling.' Buyers tried twice to break through a specific level and failed both times, signaling a strong resistance zone.
It shows that every bit of buying effort is being matched 1:1 by institutional selling. This inability to reach a higher close despite two attempts suggests that the bulls have exhausted their capital and the path of least resistance is now likely downward.
High-probability entries occur when the price breaks below the lows of the two matching candles. This breakout confirms that the 'ceiling' has held and that the buyers who were defending that level have finally given up, leading to a potential trend reversal.